


GBP Technical Analysis Talking Points:
- It’s been a tail of two trends in GBP/USD so far this month, as a bearish push in the first portion of November was soundly reversed last week.
- In the major pair of GBP/USD, price action put in a strong push towards the 1.3000 psychological level but hasn’t yet been able to scale back-above. GBP/JPY posed a trip up to fresh five-month-highs – can buyers can buyers continue to push?
- DailyFX Forecasts are published on a variety of markets such as Gold, the US Dollar or the Euro and are available from the DailyFX Trading Guides page. If you’re looking to improve your trading approach, check out Traits of Successful Traders. And if you’re looking for an introductory primer to the Forex market, check out our New to FX Guide.
GBP Strength Comes Back After Early-Month Slump
Its been a week of strength for the British Pound as the GBP showed signs of recovery against both the US Dollar and the Japanese Yen. In GBP/USD, in particular, that recovery theme is quite visible as November price action has thus far produced a ‘V-shaped’ move involving a consistent bearish trend in the first portion of the month followed by an equally consistent recovery from that move. But, similar to what was seen on October 31st and November 1st, buyers seem uninterested in a re-test of the psychological level at 1.3000, with price action posturing just below the big figure.
GBP/USD Four-Hour Price Chart
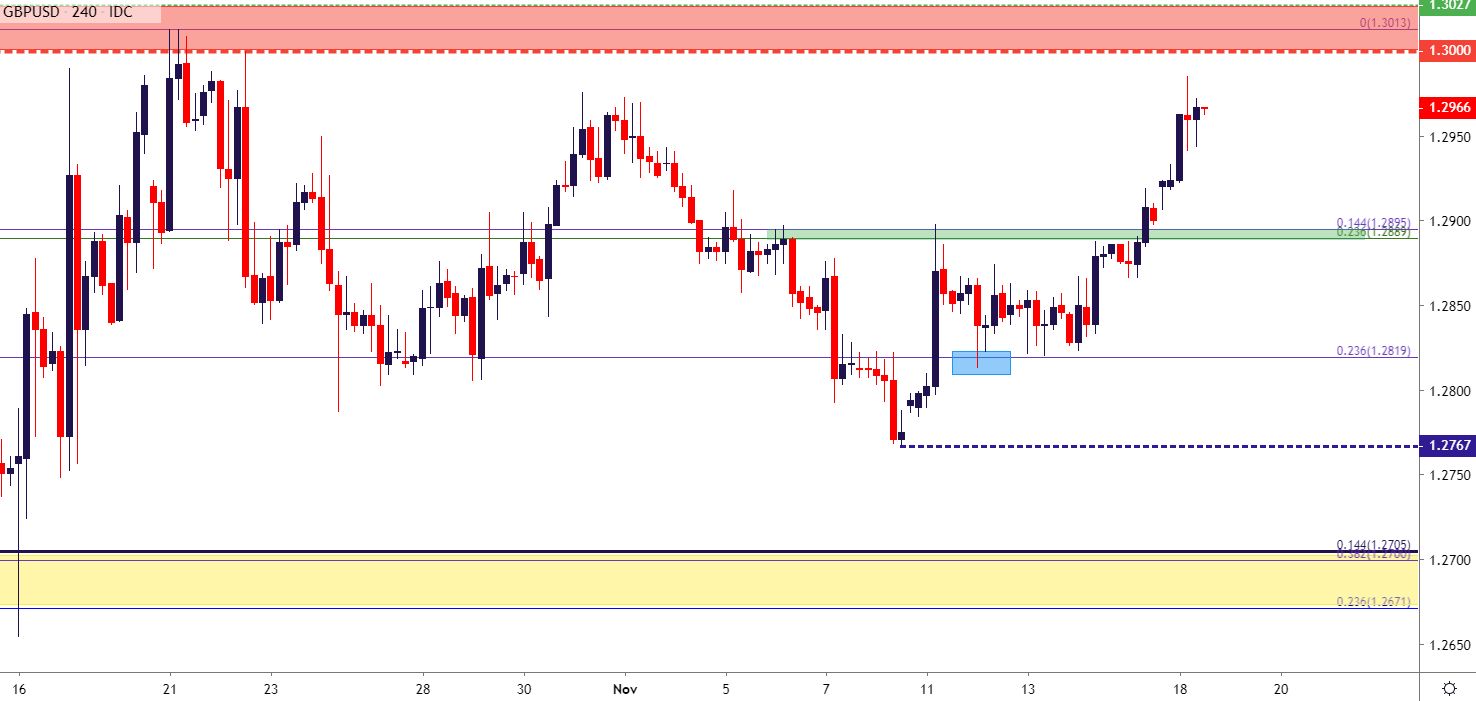
Chart prepared by James Stanley; GBPUSD on Tradingview
As looked at in the GBP technical forecast last week, GBP/JPY produced a backdrop more attractive for bullish GBP strategies, as GBP/JPY held within a horizontal range as the pullback in GBP/USD deepened. GBP/JPY has now traversed the entirety of that range and pushing up to a fresh five-month-high, but once again finding sellers around a key Fibonacci level at 141.58, which is the 50% marker of the 2018-2019 major move in the pair.
GBP/JPY Weekly Price Chart

Chart prepared by James Stanley; GBPJPY on Tradingview
GBP Strategy Moving Forward
Given proximity to longer-term resistance in both GBP/USD and GBP/JPY, bullish trend strategies could prove problematic at current prices. There is scope, however, for pullbacks in both markets that could soon re-open the door for topside strategies.
In GBP/USD, an area of interest remains around the 1.2900 handle that had previously offered near-term resistance shortly after last week’s open. This allowed for a trip down to short-term support at which point the door re-opened to longs. This zone was traded through late last week, and a push back to this confluent area on the chart can set up the pair for bullish strategies again.
GBP/USD Two-Hour Price Chart

Chart prepared by James Stanley; GBPUSD on Tradingview
In GBP/JPY, the pair had worked into a short-term range as looked at in last week’s technical forecast, with support holding around the 139.00 area. Last week saw price action break above range resistance that had showed from 140.55-140.75; with buyers pushing all the way into the October highs above the 141.50 level on the chart.
Since that failed test earlier this morning, prices have pulled back to find support around prior range resistance. This can open the door for aggressive trend strategies but, as noted above, proximity to resistance can cap top-end profit potential, and this may not be the most attractive area to investigate for long exposure. A bit deeper, however, is another level of interest at 140.23, which can open the door for stops below the 140.00 big figure in looking for bullish continuation in GBP/JPY.
GBP/JPY Two-Hour Price Chart
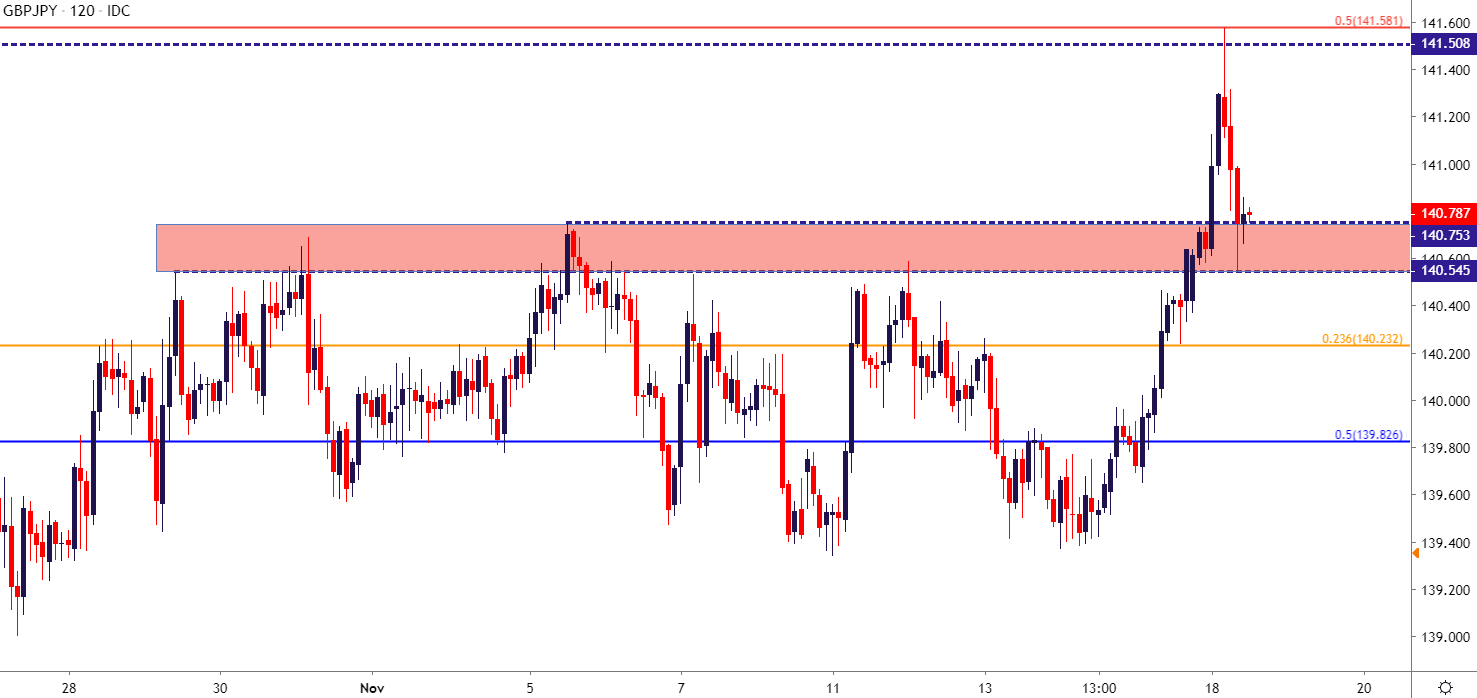
Chart prepared by James Stanley; GBPJPY on Tradingview
To read more:
Are you looking for longer-term analysis on the U.S. Dollar? Our DailyFX Forecasts have a section for each major currency, and we also offer a plethora of resources on Gold or USD-pairs such as EUR/USD, GBP/USD, USD/JPY, AUD/USD. Traders can also stay up with near-term positioning via our IG Client Sentiment Indicator.
Forex Trading Resources
DailyFX offers an abundance of tools, indicators and resources to help traders. For those looking for trading ideas, our IG Client Sentiment shows the positioning of retail traders with actual live trades and positions. Our trading guides bring our DailyFX Quarterly Forecasts and our Top Trading Opportunities; and our real-time news feed has intra-day interactions from the DailyFX team. And if you’re looking for real-time analysis, our DailyFX Webinars offer numerous sessions each week in which you can see how and why we’re looking at what we’re looking at.
If you’re looking for educational information, our New to FX guide is there to help new(er) traders while our Traits of Successful Traders research is built to help sharpen the skill set by focusing on risk and trade management.
--- Written by James Stanley, Strategist for DailyFX.com
Contact and follow James on Twitter: @JStanleyFX


