Gold Price Outlook Talking Points:
- Gold prices continue to rally following yesterday’s dovish shift at the FOMC, perhaps helped in part by a potential flare of tensions between the US and Iran that showed earlier this morning.
- Gold prices have set a fresh five-year-high, making a fast approach at the 1400 psychological level. Can buyers continue to push an already stretched topside move?
Gold Price Breaks Out to Fresh Five-Year-Highs
It’s been a busy past 24 hours across global markets, and perhaps no single area shows the intensity of the scenario as well as Gold prices. While US stocks rallying to fresh all-time-highs the day after the Fed is noteworthy, Gold prices have exploded to a fresh five-year-high to continue a trend that’s been showing very visibly over the past three weeks.
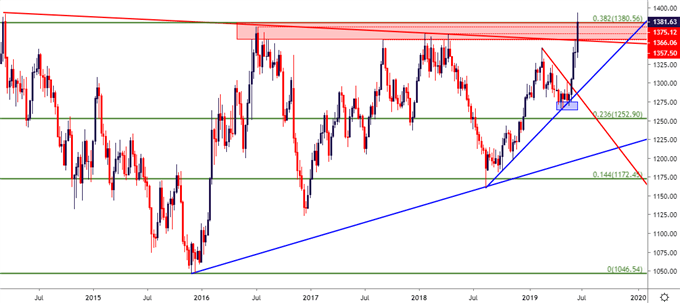
In the final days of May, Gold prices had cauterized support around a key Fibonacci level before breaking-out. And as that breakout took-hold, buyers continued to drive, soon pushing prices into a key zone of resistance that had held the highs in the yellow metal for the past five years. There were numerous prior inflections in the area that runs from 1357.50-1375, and a number of similar scenarios that had created bullish runs to bring that resistance back into play. Each of those had fallen flat; until today, that is, as buyers rushed to the bid to create a fresh five-year-high at the 1393.03 level.
Gold Weekly Price Chart

The big question after a move of this nature is usually pertaining to continuation potential. But, given the intensity of the move, it could be a daunting prospect to line up fresh exposure on either side of Gold prices at the moment. While the bullish move is quite stretched, the possibility for reversal could be of challenge given the pace with which this theme has priced-in. Meaning traders that are looking to join in on the move are likely going to need to either compromise by taking less-than-perfect entries or by being more patient. Below, I look at strategy on either side of the scenario.
Gold Price Bullish Prospects
This would be the favored side of the move given the recent theme that’s been priced-in along with the rationale behind it. The Fed posing a dovish shift via the dot plot matrix yesterday has brought strength to a number of markets, with market participants buying most assets that aren’t already nailed down. And given that this was a recent change, there may be continuation potential to work with; but it could be difficult to justify risk outlay given how far away prices are currently stretched from any nearby resistance points.
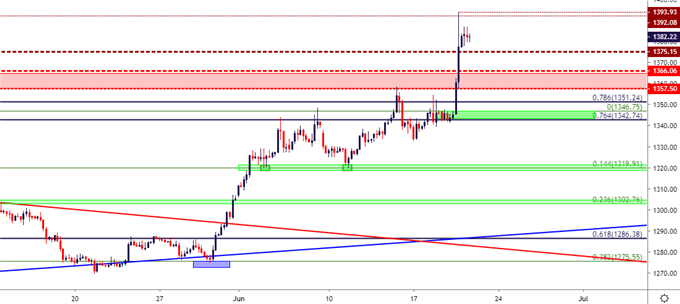
At this point, Gold price action is catching some resistance from the prior swing-high from March of 2014. This level is at 1392.08, and just overhead is a psychological level that hasn’t been in-play since August of 2013 at 1400. This leaves two areas of nearby support potential that could re-open the door for bullish trend strategies. The first zone is a batch of resistance that’s held the highs for the past couple of years. This area runs from 1357.50 up to 1366.06 and the former of those prices previously helped to come-in to mark swing-high resistance just a week ago. Now that prices have broken out, this becomes an obvious level to look to for pullback potential.
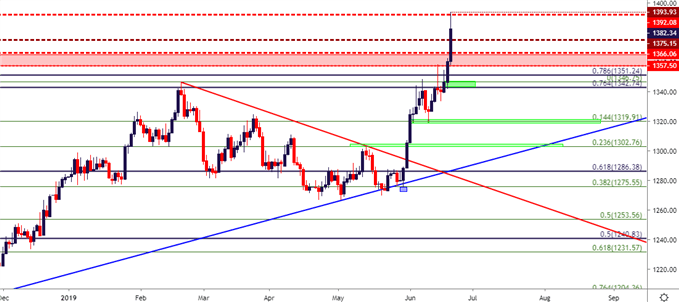
A bit-lower is another potential support area that runs from 1342.74-1346.75. The former price is the 76.4% Fibonacci retracement of the 2013-2015 major move while the latter-level was the February swing-high.
Gold Price Four-Hour Chart

Gold Price Bearish Prospects
Given how fast this recent theme has priced-in traders should be rightfully cautious of fading this move in Gold. But – given the overbought nature and the general sense of excitement that helped to create it, there could be scope for pullback here that may, eventually, turn into bigger-picture reversal potential. For now, traders harboring a bearish focus on Gold should focus on step one in looking for prices to pull back. That support areas looked at above could function as near-term target potential, with the inclusion of the prior five-year-high at 1375.15 as a closer point of support potential that could be used for break-even stop moves. That way, if the pullback is shallow and the bullish breakout continues, loss mitigation becomes the priority.
Gold Price Daily Chart

Chart prepared by James Stanley
To read more:
Are you looking for longer-term analysis on the U.S. Dollar? Our DailyFX Forecasts have a section for each major currency, and we also offer a plethora of resources on Gold or USD-pairs such as EUR/USD, GBP/USD, USD/JPY, AUD/USD. Traders can also stay up with near-term positioning via our IG Client Sentiment Indicator.
Forex Trading Resources
DailyFX offers an abundance of tools, indicators and resources to help traders. For those looking for trading ideas, our IG Client Sentiment shows the positioning of retail traders with actual live trades and positions. Our trading guides bring our DailyFX Quarterly Forecasts and our Top Trading Opportunities; and our real-time news feed has intra-day interactions from the DailyFX team. And if you’re looking for real-time analysis, our DailyFX Webinars offer numerous sessions each week in which you can see how and why we’re looking at what we’re looking at.
If you’re looking for educational information, our New to FX guide is there to help new(er) traders while our Traits of Successful Traders research is built to help sharpen the skill set by focusing on risk and trade management.
--- Written by James Stanley, Strategist for DailyFX.com
Contact and follow James on Twitter: @JStanleyFX


