


Dow Jones Outlook Talking Points:
- US equities continue to claw back losses from early-May price action, and prices in the Dow Jones Industrial Average are working on a week of higher-lows following last week’s gap-lower.
- As the potential for risk aversion remains, with a bit of opacity around the Fed’s stance combined with worries on the trade-front, buyers have returned to make a push back towards the 26k psychological level.
- DailyFX Forecasts are published on a variety of currencies such as the US Dollar or the Euro and are available from the DailyFX Trading Guides page. If you’re looking to improve your trading approach, check out Traits of Successful Traders. And if you’re looking for an introductory primer to the Forex market, check out our New to FX Guide.
Do you want to see how retail traders are currently trading GBPUSD? Check out our IG Client Sentiment Indicator.
Dow Jones Continues to Recover From Last Week’s Spill
US equities continue to recover following last week’s gap-lower. In Dow futures, last Sunday’s open saw prices gap-down, and bearish run continued to show amounting to a very ugly Monday for equity bulls. At that point, an element of support came into play around 25,266, which is the same level that helped to set the March low in the Dow. This is derived from the 14.4% Fibonacci retracement of the August 2015 – October 2018 major move and this has helped to mark the three-month-low in the index.
Dow Jones Eight-Hour Price Chart
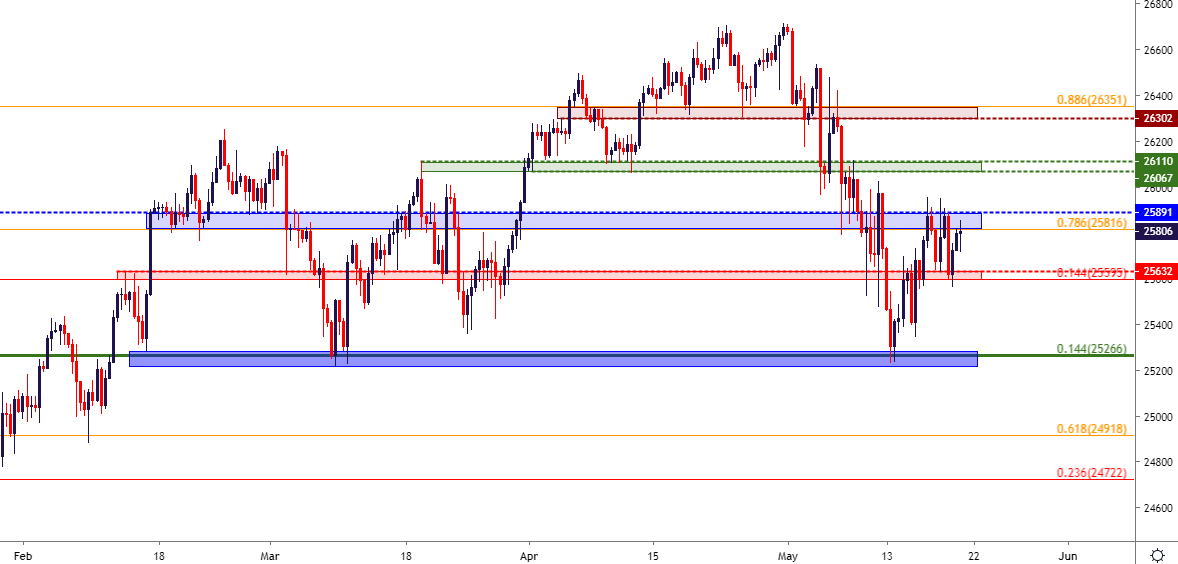
Chart prepared by James Stanley
Dow Resistance Test at Last Week’s Highs
Buyers have continued to shy away from the 26k psychological level as last week’s advance topped-out around 25,950 on Thursday; and another attempt to take this level out on Friday had failed, leaving a lower-high on the chart ahead of last week’s close. But, similar to last week, sellers took a swing at Dow futures after the weekly open and pushed prices-lower for a re-test of the 25,595 support zone. Different from last week, however, that bearish run was stopped short and buyers soon re-appeared, helping to bring prices back towards last week’s resistance. This gives the appearance of continued topside potential as there are now a series of higher-lows showing on the chart from last week’s gap-lower.
Dow Jones Four-Hour Price Chart

Chart prepared by James Stanley
Dow Jones Levels to Know
Given the series of higher-lows that have shown through a couple of different bearish waves thus far, and there may be scope for continued topside. The primary complication, at this point, would be the congestion that’s developed inside of the 26k psychological level. Above that, a prior area of support resistance could be looked to for follow-through resistance, and this runs from 26,067-26,110. The latter of those prices was the late-March swing-high while the former was the April swing-low. Above that, the next area of interest in the zone that runs from 26,302 up to 26,351. This was a zone of support that held the lows in the index through multiple bearish drives in the last three weeks of April, only being taken-out as bears started to swing with more force after the May open.
On the bearish side of the Dow, sellers would likely want to see the chain of recent higher-lows to be broken before looking at further downside. That most recent higher-low shows around the 25,544 level, and a push below that could re-expose the 25,266 support. That’s where matters could get very interesting for sellers, as a breach below that level exposes bearish breakout potential down to 25k. If sellers can take that zone out, the theme around a bigger-picture sell-off will grow more attractive, and this can expose deeper support potential around 24,722 followed by 24,286.
Dow Jones Two-Hour Price Chart
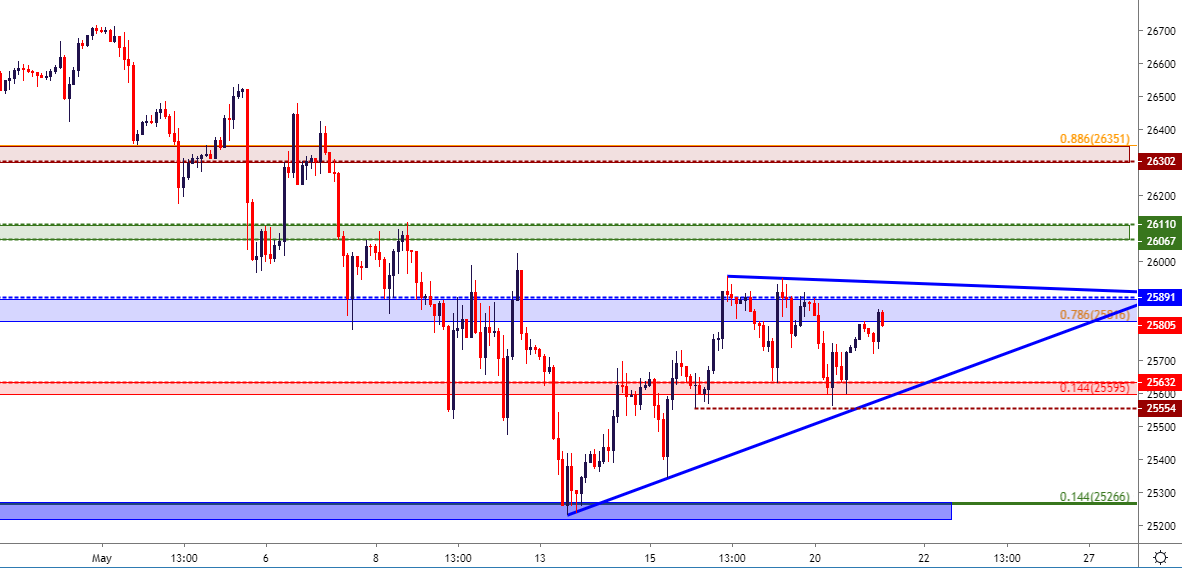
Chart prepared by James Stanley
To read more:
Are you looking for longer-term analysis on the U.S. Dollar? Our DailyFX Forecasts have a section for each major currency, and we also offer a plethora of resources on Gold or USD-pairs such as EUR/USD, GBP/USD, USD/JPY, AUD/USD. Traders can also stay up with near-term positioning via our IG Client Sentiment Indicator.
Forex Trading Resources
DailyFX offers an abundance of tools, indicators and resources to help traders. For those looking for trading ideas, our IG Client Sentiment shows the positioning of retail traders with actual live trades and positions. Our trading guides bring our DailyFX Quarterly Forecasts and our Top Trading Opportunities; and our real-time news feed has intra-day interactions from the DailyFX team. And if you’re looking for real-time analysis, our DailyFX Webinars offer numerous sessions each week in which you can see how and why we’re looking at what we’re looking at.
If you’re looking for educational information, our New to FX guide is there to help new(er) traders while our Traits of Successful Traders research is built to help sharpen the skill set by focusing on risk and trade management.
--- Written by James Stanley, Strategist for DailyFX.com
Contact and follow James on Twitter: @JStanleyFX


