


Key Takeaways on SPX500 And Falling SMART Index:
- The high correlation between SMFI and the S&P 500 may spook equity bulls further
- Institutional investors appear to have less confidence in the market
- Large drop in the SMFI can signal drops in the S&P 500
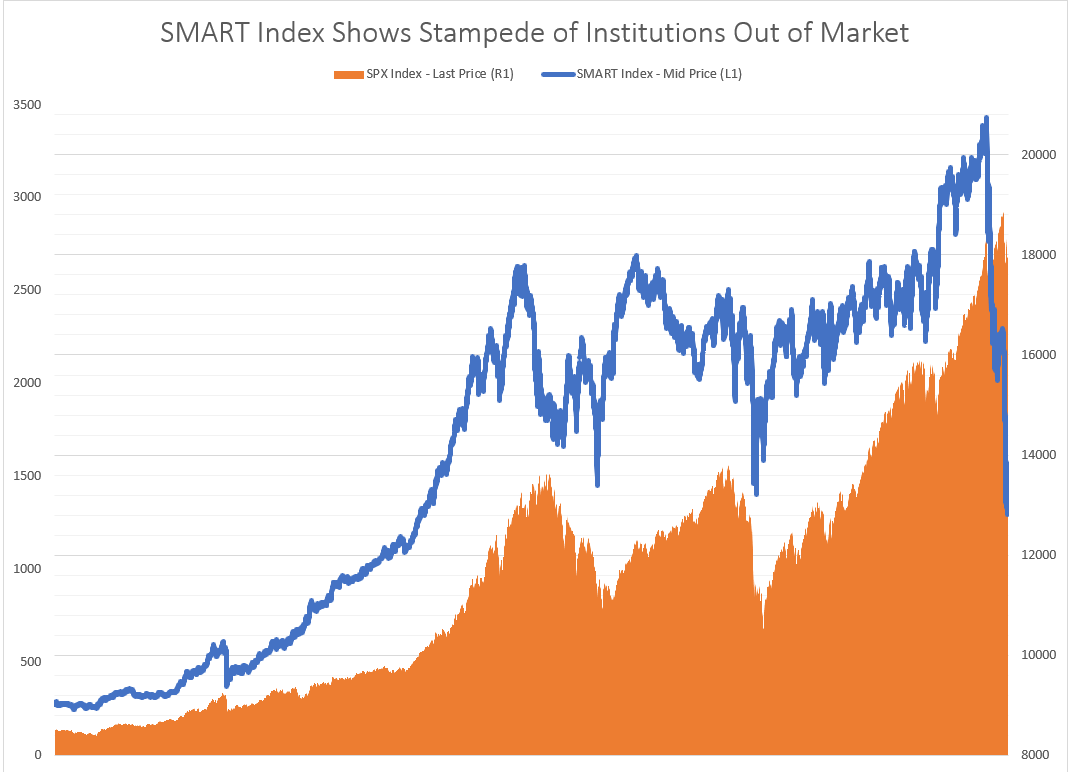
SMART Index Has Fallen ~40% To Lowest Levels Since 1996
Data source: Bloomberg, WallStreetCourier.com
What’s Going On?
Since January, the SMART index has broken down showing potentially that a market narrative led by governmental agreements (US-China, UK-EU, & USMCA, et al.) alongside higher volatility and high valuations by historical comparisons have made institutional investors wary. If experienced institutional investors have hesitation, this may indicate a potential drop in the equity market that may have already begun.
Why Is This Important?
If we look as far back as 2007, we notice that the SMFI and the S&P 500 have consistently moved in the same direction, hence their high correlation of 0.91.
As demonstrated in the graph, the SMFI has dropped by 38% since the January high, and the S&P 500 has wobbled off the high. Given the prior correlation, this sharp drop in the SMART index can hurt confidence in a swift recovery. The level of the SMART index recently hit the lowest level since October 1996.
Although the correlation throughout the years has been quite high, it is in no way a cause and effect situation. It is simply one of the many elements to consider when analyzing the market’s trend.
Lastly, it appears that institutions never jumped back in after the drop in early February. From the low in early 2018 to the high in October, institutions continue to leave the market per the SMART index.
What Is The Smart Money Flow Index?
It is a good indication of how institutional investors are engaged in the market. The SMART Index takes the difference in action of the Dow in the first 30 minutes - which are mainly irrational trades driven by emotions from the overnight news, and the last hour. The last hour reflects experienced investors that are making their move after analyzing the day.
Some have discounted the effect of the SMART Money Index as share buybacks from corporations and ETF flow have dominated the market. However, the reduction seems to favor a shift of appetite in the market that should hold trader's attention.
Want More?
Sr. Analyst, Tyler Yell, CMT covers this indicator and more in the DailyFX podcast; Trading Global Markets Decoded that you can access here.
Written by Tyler Yell, CMT, Nancy Pakbaz, CFA


