


Fundamental FX Factors Talking Points
- Yields And The Carry Trade Drivers
- Growth Drivers In An Economy And The Effect On FX Rates
- Current Account Dynamics
- FX Volatility and Risk Forecasts
Fundamental analysis is a mixed bag, but traders shouldbe cautioned from turning away from its insights. Fundamentals tend to drive capital flows, which in turn, drive FX rates. As a trader who would never turn away from using technical analysis to manage risk, it’s worth having the ‘bigger picture’ to see when a trend has juice left or the fundamentals beneath the trend are deteriorating.
This primer will serve as a guide for a series that keeps traders aware of how key fundamental themes are developing, and what that means for FX markets, and most importantly, their trades.
Understanding Yields & Their Force in The FX Market
Traders who wish to grab a fundamental understanding of what’s driving currency values relative to another should start with yields. Yields are a term of the bond market that helps investors see how much an investment in debt will return (i.e., yield) based on how they purchased the debt contract, plus the coupon paid the perceived risk of the borrower determines that.
Interest rates are critical in FX as they determine in large part the Carry Trade where investors will borrow in one currency at a lower interest rate and buy a currency that yields more to pocket the spread. There are multiple ways (too many to discuss here) that the carry trade can be played by traders and investors whether through a clear spot trade, swap, futures, or another asset that pays yields based on currency differentials.
A key driver of interest rates have been central bank policy and inflation drivers. As the CIO of PIMCO’s Global Credit desk, Mark Kisel recently said, “Bonds [in 2018] are starting to get exciting.” He followed that by saying he hasn’t been able to say that for a long time. Exciting could be plugged with volatile, and the meaning would not change.
What FX traders should note is that a volatile change in yields will likely lead to volatile capital flows that will then lead to rather volatile FX rates. Therefore, FX traders keeping an eye of fundamental drivers should start, and some could say could nearly wrap up, their focus on yields given all that is baked into interest rates and how much rates drive FX. Another note is that most institutions combine their interest rate trading desks alongside their FX desks.
A key focus in markets of late has been real yields. Real yields are also called inflation-linked yields. In other words, fixed income investors get (wait for it), fixed income. By getting fixed income, they are more subject to inflation’s effect on the fixed contractual cash flows than anyone in finance. The real yield, therefore, equates the return investors in fixed income would receive to the return an investor would receive who invests in an inflation-indexed bond. A common inflation index that is often attached to is the Consumer Price Index or CPI.
US 2YR Yield Vs. US Dollar Index

Data Source: Bloomberg
Another reason to keep an eye on fixed income or credit markets is that this is where crises typically show up first. The great financial crisis was also known as the credit crises, and the logic makes sense. Bond investors get seniority preference of any cash flows a business generates, so a company unable to pay bondholders (also known as defaulting) tends to be the first emergence of trouble in financial markets.
A key thing within bond markets that should be looked at is the yield curve or yield spreads.Specifically in focus is the inverting, and potential inversion of the US yield curve. An inverted yield curve occurs when longer-term Treasury Notes (US sovereign bonds) have a lower yield or higher price than their shorter-lived counterparts, typically the 2-year note. The US 2-10 yield curve has become the flattest (2-year yield rising faster than 10-year yield) since 2005.
Chart: US 2-10 yield curve (1980-Present)

Data Source: Bloomberg
Obviously, 2005 was still in the midst of a booming economy that was being lifted by unprecedented real-estate buying in the US that would eventually lead to the credit crises that first made headlines in 2007 before ‘credit crisis’become a household term in fall 2008.
Economic Growth Drivers
Businesses and economies as a collection of businesses are about growth. Business’ measure earnings and profit margin growth as a way of showing a competitive edge that allows said businesses to attract more capital, invest more capital and positive-yielding projects and return more capital to shareholders.
Economies look to do the same but through a combination of industries and macro factors that help investors see if an economy is attracting or repelling money from abroad. Naturally, a strong inflow of capital tends to lead to local currency appreciation while a stronger outflow of capital, whatever the cause, tends to lead local currency depreciation.
Capital markets and their attractiveness to international investors have long been a key factor in whether not money isflowing in or out of an economy. Another key tenet of economic growth is the health of the labor market as well as technological progress in an economy. To put this all in a word, we’re looking at demand and relative demand at that.
Demand that drives economic growth is often seen through the lens of increased labor demand being increasingly productive, typically through technology, with sufficient capital used to support the labor force.
International investors and central bankers tend to look at both the actual and potential growth of an economy. If actual growth is lagging potential growth, central bankers and sometimes politicians get to work. The goal is to get the gap between the potential growth rate of an economy to close between the actual growth rate of the economy. Using the factors above, traders tend to look of boosting demand and labor productivity through a handful of key fundamental data points such as:
ISM Manufacturing Index by the Institute of Supply Management (monthly)
- Can greatly affect business and investor confidence
- Surveys purchasing managers at the forefront of corporate supply chains
- Rapid response to fluctuating demand
Consumer Price Index (CPI)
- Inflation data provided on a monthly and year-over-year basis
- Key focus of central bankers to understand dynamic demand
- Falling inflation is a key concern as it reduces the desire to buy today and stimulate growth
- Too much inflation can be seen as bad as inflation tends to jump quicker than incomes
Other key pricing metrics:
- Producer Price Index
- PCE Deflator – known as the Fed’s preferred inflation measure
- Import Price Index
- Export Price Index
- Average Hourly Earnings – A component of NFP
Industrial Production (IP)
- As the name implies, this is a monthly measurement of the output of industrial establishments but helps shows growth in real (physical) assets
Employment Data
- Non-Farm Payrolls (US), and other economy employment data
- Unemployment Rate/ Jobless Claims
Putting what we’ve covered altogether, you can likely see what a data point like Non-Farm Payrolls is crucial to the market. In short, in a consumer-driven market like the US (and soon to be China,) employment data often adds up to more than the sum of its parts.
In short, employment data in the US shows how aggressively companies are filling roles, which shows economic growth, quit rate, which shows economic confidence or confidence in the ability to find a new job, and the recently all-important Average Hourly Earnings or AHE.
Average Hourly Earnings has been under considerable scrutiny lately as economists expected the economic growth seen in commodities and other assets to translate to higher wages that would, in turn, boost inflation. Seemingly, that had failed to pass the test, until Q4 2017 when AHE in the US jumped and is currently at the highest levels since 2009. The recent rise is bringing more hope to those seeking inflation as proof that the economy is on a sustainable path higher like equity and commodity investors.
US Average Hourly Earnings Has Accelerated To Highest Levels Since 2009
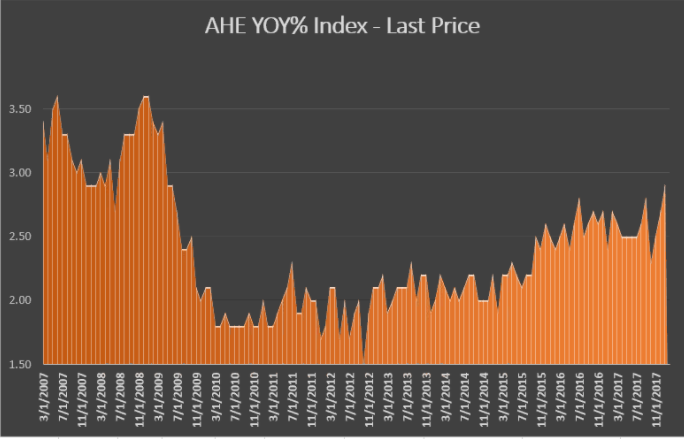
Data source: Bloomberg
Current Account Dynamics: A Key Focus of Economic Health on a Global Scale
Current Account surpluses and dynamics may sound like something you’d only see on a economics final exam, but you shouldn’t be quick to overlook this data point, especially in 2018. A Current Account is a measure of how much a country is exporting relative to how much it is importing. A country that imports more than it exports or buys more than it produces and sells abroad is going to have a current account deficit. Such a situation makes an economy a net debtor abroad, and as you can imagine, makes the credit quality of the economy crucial.
A Current Account surplus occurs when a country exports more than it imports, making it a net creditor to the global economy. China and Japan are textbook examples as are other smaller Emerging Market economies like Myanmar or India. A current account surplus does mean that an economy is reliant on healthy global demand to keep the economy humming along, but it makes the economy much less susceptible to aggressive swings in funding markets.
Heading into the Brexit vote of June 2016, Bank of England Governor, Mark Carney warned that a key reason why he had a hard time seeing the Brexit as a viable path forward was the significant current account deficit in the UK. In short, the Current Account deficit relative to GDP was -5.8%. Such an extreme reliance on external funding had Carney warn that the UK could become a ‘beggar nation,’ that was reliant on generous funding terms from other creditors for the UK to stay afloat.
Chart: UK Current Account Deficit Was An Argument Against Brexit Per BoE's Carney
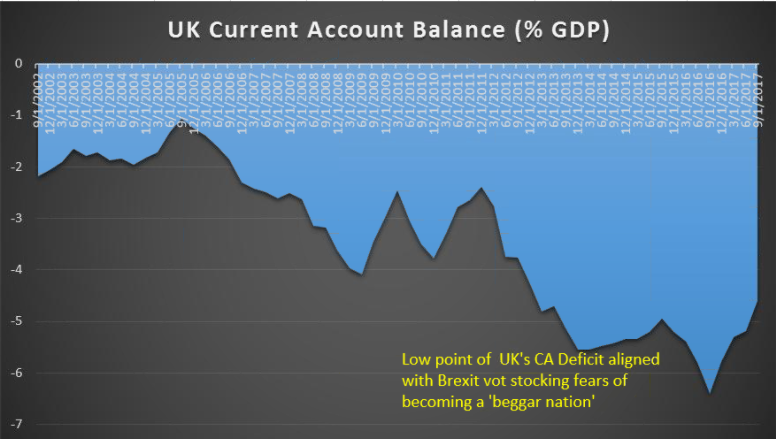
Data Source: Bloomberg
In 2018, the US has given traders a new cause for concern with an unusual name for most. The problem is called the twin-deficit. In short, the idea is to look to the US Current Account Deficit, which is manageable at -2.3% of GDP. However, when you look at the CA from a currency adjusted point of view as the Dollar Index has fallen aggressively, the current account deficit becomes less manageable. The US Dollar Index has fallen as much as -13.31% when looked over the last year.
Added to the currency adjusted current account deficit is the Treasury Budget as % of GDP. This is the second factor making it a twin reading. Specifically, it’s looking to how aggressive the US Government is looking to be in funding gaps between revenue and expenditures. Given the aggressive fiscal stimulus in 2018 and beyond planned by the current administration. The US looks to be increasingly reliant on foreign funds at a time when the USD is near 3-year lows, and the expected borrowing needs are only expected to rise.
The US Twin Budget Deficit Has Widened Aggressively Since Last Summer

Data Source: Bloomberg
As you can imagine, if new data comes out that the US Current Account deficit widens and the Treasury demands for borrowing increase, it could put significant pressure on the US. What’s more, a weaker currency would likely be welcome until it becomes a problem like inflation running rampant.
Another key market that echoes the current account dynamics is the Terms Of Trade. The terms of trade are indexed to show how much exports can purchase of the imports that an economy is likely to produce and likely purchase. Export-dependent economies like Australia will have their Terms of Trade scrutinized more closely than other economies with less export focus.
Looking To Pros for Insight via Volatility & Positioning
A key way to look at what is expected over the next week or month, a time frame in focus for most FX traders is through options volatility. Option’s pricing models have been a marvel of the science of financial markets over the last 40 years. A key marker of the options pricing model is that of the market-derived imputes, only one is implied, and that is volatility.
In other words, volatility is a plug figure that helps to explain why an option is priced as is and helps to explain to traders what is expected over the time the options contract is in play. All things being equal, higher expected volatility leads to a higher options price while lower implied or expected volatility leads to a lower options price. For traders looking for sharp market moves, implied volatility can be a godsend of info of knowing where to expect juice in the market that they can capitalize on with a trade.
Implied Volatility is something that I cover heavily on the FX Closing Bell webinar.
The other key data point is intuitional positioning, per the CFTC’s Commitment of Traders Index or CoT. The CoT doesn’t show real-time data, but on Friday’s the data will be released to show you how Hedge Funds and corporate hedgers are positioned in the FX market. What makes this different than the IG Client Sentiment data is the size of the trades that are being placed by these players.
EURUSD Heading Higher Was Propelled by Institutions Going Long EURUSD

Data Source: Bloomberg
In short, they can move the market when moving in unison, so it’s worth it to watch.
New to FX trading? No worries, we created this guide just for you.
---Written by Tyler Yell, CMT
Tyler Yell is a Chartered Market Technician. Tyler provides Technical analysis that is powered by fundamental factors on key markets as well as t1rading educational resources. Read more of Tyler’s Technical reports via his bio page.
Communicate with Tyler and have your shout below by posting in the comments area. Feel free to include your market views as well.
Discuss this market with Tyler in the live webinar, FX Closing Bell, Weekdays Monday-Thursday at 3 pm ET.
Talk markets on twitter @ForexYell
Join Tyler’s distribution list.


