

Key Highlights:
- NZD government coalition looking to JPY-style focus on export supporting currency regime
- CAD expectations for volatility into BoC next week heat up
- Japan election is seen as a near-lock for Abe’s LDP leading to JPY-selling
- IGCS Highlight: NZD/USD 33% daily increase in long positions warns of downside continuation
Strong Weak Analysis is a way to identify momentum in the FX market. Trend traders rely on spotting and riding momentum as it develops and looks to benefit from trends extending, as many do. It’s also worth noting when the strength of a trend is waning, which Strong Weak analysis can also benefit.
Each day will bring you an index of strong and weak currencies as identified via the methodology in our article, ‘How to Create a "Trading Edge": Know the Strong and the Weak Currencies.' I will also share with you sentiment developments via IG Client Sentiment that can provide additional insight to help you decide what trends could extend.
A new column has been added to help explain the overnight at the money implied volatility per options. The model below is looking at % change from one day to a next, and a higher number favors higher expected volatility in the near future. Implied volatility regardless of tenor is a measure of the market’s priced in or expected future volatility of a currency. Our focus here is over the next 24-hours.
Access our trading guides to help you develop your trading strategy
Strong/ Weak Index October 19, 2017
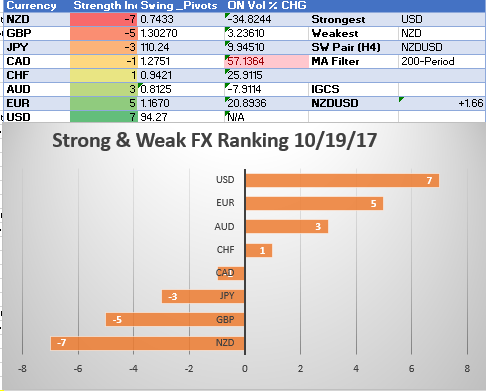
Chart created by Tyler Yell, CMT
Highlights:
-The New Zealand Dollar may be on the cusp of a new currency regime. There are more questions than answers, but the 2% drop should help you communicate that the NZD is no longer a likely contender for dip-buying. Overnight, Winston Peters of NZ First announced that his party would back the opposition and not the incumbent party. The coalition is expected to make the 37-year old Jacinda Ardern the new PM. The platform has argued for full employment, limiting immigration, and understanding that "[NZ] start to return to an economy that realizes that we live or die by exports.” That is one of the more dovish comments I’ve heard from a government since Abe introduced Abenomics in 2012.
- The Canadian Dollar does not have a clear position on the strong/ weak scale, but it easily could over the next seven days. A week from today, traders will have a clear understanding of Canadian inflation given Friday’s CPI print and the Bank of Canada’s outlook for rate hikes. The expectation of a hike at the October 25 meeting has declined from over 50% in mid-September to now around 21%. There is currently a 47% probability of a BoC rate hike in early October. Any significant change to that probability will lend to a likely move toward the top or bottom of the SW model.
-You can’t keep a strong currency down. That appears to be the message of the EUR that has seen a stall in Bullish momentum, but a failure of selling to take hold. The options market is showing a keen focus on the ECB meeting next week with a specific focus on EUR/JPY that will highlight the ECB announcement that is expected to lay out tapering plans and the Japanese elections on October 22 that is pricing in an increased power grab by Shinzo Abe’s LDP party. Short-term options are giving a relative premium to EUR calls over the next week, which favors EUR strength against other currencies.
Interested in DailyFX’s FREE longer-term price forecasts? Click here to access
IGCS Highlight: NZD/USD 33% daily increase in long positions warns of downside continuation
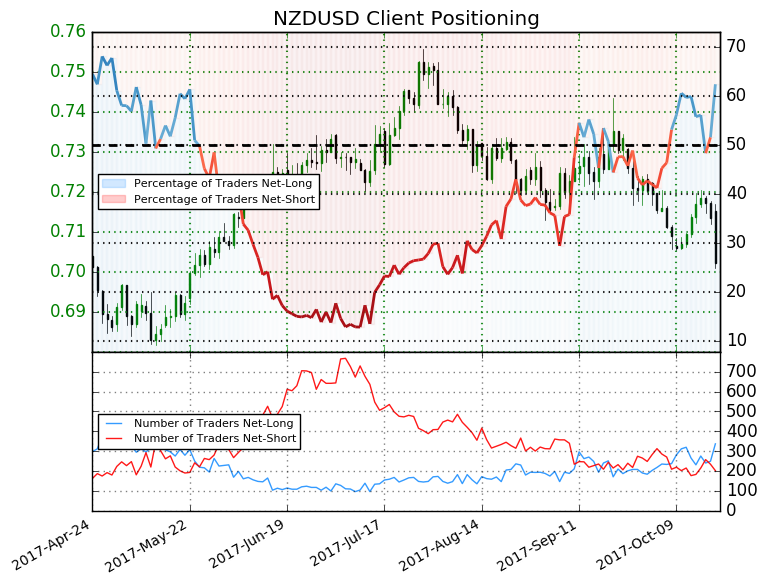
NZDUSD: Retail trader data shows 64.2% of traders are net-long with the ratio of traders long to short at 1.79 to 1. The percentage of traders net-long is now its highest since Oct 12 when NZDUSD traded near 0.7136. The number of traders net-long is 33.6% higher than yesterday and 21.1% higher from last week, while the number of traders net-short is 20.7% lower than yesterday and 0.5% higher from last week.
We typically take a contrarian view to crowd sentiment, and the fact traders are net-long suggests NZDUSD prices may continue to fall. Traders are further net-long than yesterday and last week, and the combination of current sentiment and recent changes gives us a stronger NZDUSD-bearish contrarian trading bias (emphasis mine.)
For a deeper explanation on what’s been shared above, please join the FX Closing Bell Webinar with Tyler Yell
---
Written by Tyler Yell, CMT, Currency Analyst & Trading Instructor for DailyFX.com
To receive Tyler's analysis directly via email, please SIGN UP HERE
Contact and discuss markets with Tyler on Twitter: @ForexYell