


Highlights:
- Dollar apparently is not cheap enough to encourage value buyers, downtrend momentum builds
- Gold price jumps above $1,300 while Oil trades 3% lower intraday on drop in refinery demand
- AUD attracts hedge funds per CFTC data, EUR trades within 30 pips of 1.2000
- Sentiment Highlight Oil short positions swell by 65% WoW, further downside favored
Traders appear in doubt that the US Dollar is a good value, despite falling ~10% YTD. There remains a concern that the debt ceiling will be lifted, which could lead to a technical default (IOU), and doubts about successful NAFTA negotiations are compounding after Jackson Hole. This fundamental trifecta has left traders concerned that growth and pending inflation remains out of reach for the US, and therefore, the Fed will likely refrain from tightening policy.
The big winners in the wake of USD weakness on Monday were the Australian Dollar and the Euro. The Australian Dollar traded to a 3-week high and was boosted by an increase in long positions from hedge funds that raised the aggregate net-long AUD position to the highest level in four years. For the EUR, we saw a move toward 1.2000, with an intraday high of 1.1974. Given the technical studies and bearish USD momentum, it appears that we will see 1.2000 hit, and it’s fair to think that 1.2250 is in order as the DXY is looking to move below the 200-WMA.
Be confident with your strategy and your market outlook by consulting our top FREE trading guides.
In the commodity sector, the focus at the start of the week was appropriately on the spread between gasoline (which traded higher) and crude oil (traded lower). As argued on Friday, the major source of Crude Oil demand that has led to persistent drawdowns in US Crude Oil Inventories was record refining, many of which were along the Gulf of Texas that was hit hardest by Hurricane Harvey. Hurricane Harvey is not done with the devastation, and there is fear that the flooding could get worse from here, and not better as more rainfall is expected.
On a bright note in the commodity space, the bullish momentum behind base metals seems to have bled into the precious space. The price of Gold is set to close above $1,300 for the first time in 2017 on the persistent weakness of USD. Not to be outdone, Copper continued to extend its rally to 2014 highs on encouraging data about Chinese growth prospects.
Keep an eye on our economic calendar for Economic Data Points
Are you looking for trading ideas? Our Q3 forecasts are fresh and ready to light your path. Click here to access for FREE.
JoinTylerin his Daily Closing Bell webinars at 3 pm ET to discusstradeable market developments.
FX Closing Bell Top Chart: Gold price could be in first stages of a double-bottom bullish pattern
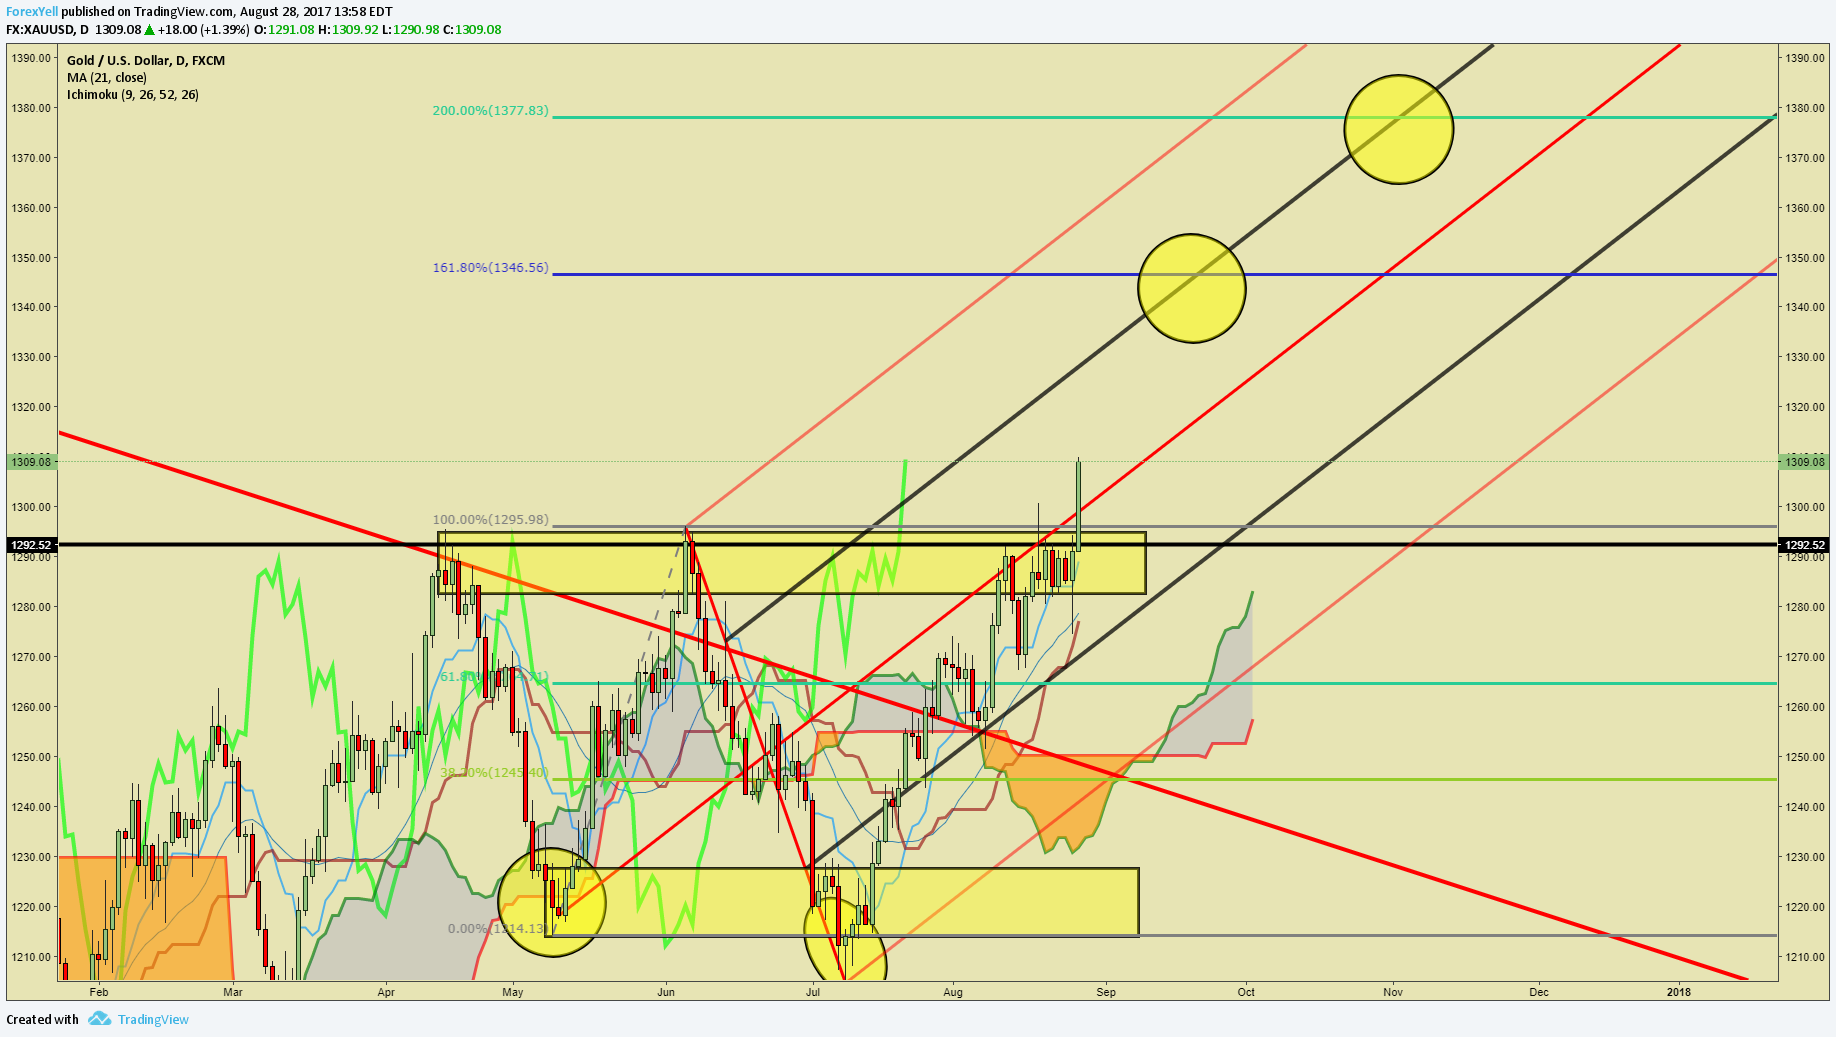
Chart Created by Tyler Yell, CMT
Next Week's Main Event: USD Consumer Confidence (AUG)
IG Client Sentiment Highlight: Oil Price Looks Likely to Break Down Further
The sentiment highlight section is designed to help you see how DailyFX utilizes the insights derived from IG Client Sentiment, and how client positioning can lead to trade ideas. If you have any questions on this indicator, you are welcome to reach out to the author of this article with questions at tyell@dailyfx.com.

Oil - US Crude: Retail trader data shows 76.8% of traders are net-long with the ratio of traders long to short at 3.31 to 1. In fact, traders have remained net-long since Aug 14 when Oil - US Crude traded near 4894.0; price has moved 4.3% lower since then. The percentage of traders net-long is now its highest since Jun 21 when it traded near 4253.4. The number of traders net-long is 37.8% higher than yesterday and 70.2% higher from last week, while the number of traders net-short is 13.2% lower than yesterday and 22.0% lower from last week.
We typically take a contrarian view to crowd sentiment, and the fact traders are net-long suggests Oil - US Crude prices may continue to fall. Traders are further net-long than yesterday and last week, and the combination of current sentiment and recent changes gives us a stronger Oil - US Crude-bearish contrarian trading bias. (emphasis added).
---
Written by Tyler Yell, CMT, Currency Analyst & Trading Instructor for DailyFX.com
To receive Tyler's analysis directly via email, please SIGN UP HERE
Contact and discuss markets with Tyler on Twitter: @ForexYell


