Highlights:
- Swiss Franc takes the day’s prize as haven currency alongside weak gains for USD
- US 10Y Auction saw lowest bid-to-cover ratio since November, shows risk-off is far off
- Gold price extends above chart resistance; Oil fails to breakout despite EIA inventory draw
- Sentiment Highlight: Euro Traders Stop Selling - Watch the Next Move
The stage appeared to be set for a strong move into haven assets like the Japanese Yen (JPY), Swiss Franc (CHF), Gold (XAU), and U.S. Treasuries. While Gold did see a continuation move higher, despite lagging its next-generation haven asset counterpart, Bitcoin, the US 10Y Treasury may have shown that fear is not ready to explode yet. As the sun is about to set on summer volatility, the $23b auction of 10-year US Treasuries was met with uninspiring demand on Wednesday, which may show the risk-off demand may not carry through to the end of the week without escalated rhetoric from either US President Trump on Kim Jung-un of North Korea. The evidence of weak demand for US sovereign debt was seen with the lowest bid/cover since November as the yield, which falls as price rises, remains near the lowest level of the year.
Despite the weak UST auction, there remains concerns as evidenced by the slowly strengthening Japenese Yen, which is pressing closer to 2017 extremes. As the second month of H2 2017 gets underway, a key story worth watching is whether the firming up of US data is going to stick or if the trend of US weakness that has permeated this year will remain. As we saw on Friday morning, the US employment picture remains encouraging alongside housing activity, but inflation has been ‘Amazoned’ and remains AWOL. However, any signs that Fed policy could tighten beyond what the market is pricing in, which is not much, could lift the US Dollar. Should the risk-off fears subside as evidenced by today’s weak UST auction, the USD could do particularly well against funding currencies like CHF and JPY as well as the unstable GBP. However, an escalation in rhetoric from President Trump would quickly through that playbook out of the window.
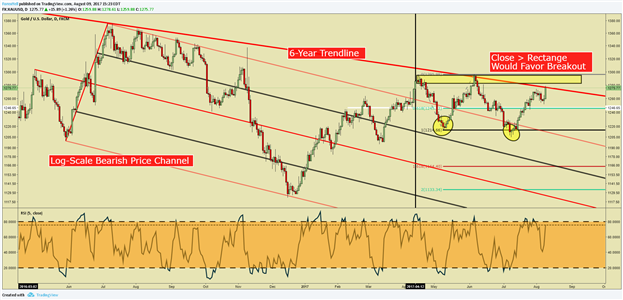
Commodities have been a key story since July saw a major turn arounds in base metals thanks in large part to very strong demand from China. However, given that Gold has only risen by 6% in H2 vs. other markets that have risen over 20% like Iron Ore, it has failed to gain much attention. That may be about to change, as Gold closed on Monday at the highest level since early June and could be set for a move above $1,300/oz.
The other focus of the commodity world is Crude Oil, which had another positive weekly EIA Oil Inventory Report on Wednesday. While there were some stockpile gains seen in Cushing, OK and in gasoline thanks to the six-year high in imports, overall stockpiles declined and provided a fundamental argument that any price weakness would likely not last long.
Are you looking for trading ideas? Our Q3 forecasts are fresh and ready to light your path. Click here to access for FREE.
Join Tyler in his Daily Closing Bell webinars at 3 pm ET to discuss tradeable market developments.
FX Closing Bell Top Chart: Gold Price looks set to test the second price breakout of 2017

Chart Created by Tyler Yell, CMT
Tomorrow's Main Event: NZD RBNZ's Wheeler news conference on policy statement
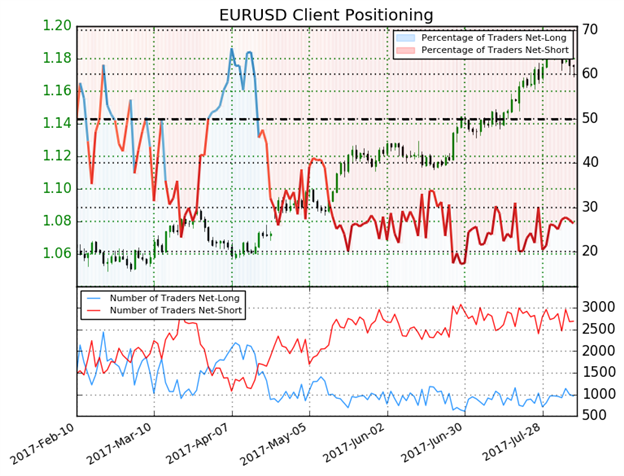
IG Client Sentiment Highlight: Euro Traders Stop Selling - Watch the Next Move
The sentiment highlight section is designed to help you see how DailyFX utilizes the insights derived from IG Client Sentiment, and how client positioning can lead to trade ideas. If you have any questions on this indicator, you are welcome to reach out to the author of this article with questions at tyell@dailyfx.com.

EURUSD: Retail trader data shows 26.4% of traders are net-long with the ratio of traders short to long at 2.79 to 1. In fact, traders have remained net-short since Apr 18 when EURUSD traded near 1.06524; price has moved 10.3% higher since then. The number of traders net-long is 21.0% lower than yesterday and 13.2% lower from last week, while the number of traders net-short is 13.1% lower than yesterday and 5.2% lower from last week.
We typically take a contrarian view to crowd sentiment, and the fact traders are net-short suggests EURUSD prices may continue to rise. Traders are further net-short than yesterday and last week, and the combination of current sentiment and recent changes gives us a stronger EURUSD-bullish contrarian trading bias. (Emphasis added)
---
Written by Tyler Yell, CMT, Currency Analyst & Trading Instructor for
DailyFX.com
To receive Tyler's analysis directly via email, please SIGN UP HERE
Contact and discuss markets with Tyler on Twitter: @ForexYell


