


US GDP Report Overview
- The revised Q2’19 US GDP report is due on Thursday, August 29 at 12:30 GMT and the data should soothe concerns about an immediate slowdown in the US economy.
- The NY Fed Nowcast is looking for Q2’19 US GDP at 1.5%; consensus forecast per Bloomberg News calls for the headline figure to come in at 2.1%.
- Retail traders have remained net-long since May 3 when USDJPY traded near 111.98; price has moved 5.9% lower since then.
Join me on Mondays at 7:30 EDT/11:30 GMT for the FX Week Ahead webinar, where we discuss top event risk over the coming days and strategies for trading FX markets around the events listed below.
08/29 THURSDAY | 12:30 GMT | USD Gross Domestic Product (2Q S)
According to a Bloomberg News survey,the US economy grew by 2.1% in Q2’19, down from the initial 2.2% pace reported last month. Even as financial markets price in greater odds of a US recession per the US Treasury yield curve, US economic data simply hasn’t been that bad: Q3’19 US GDP estimates are holding in the low 2% range as well.
But as mounting uncertainty over the US-China trade war continues to erode certainty over the near-term economic outlook, traders seem to be paying less attention to backwards-looking reports (“hard data”) and are more concerned with forward-looking surveys and sentiment indicators (“soft data”). Only a significant deviation from the estimate would provoke a sharp repricing in Fed rate cut odds.
NY Fed Nowcast Q2’19 US GDP Forecast (August 23, 2019) (Chart 1)
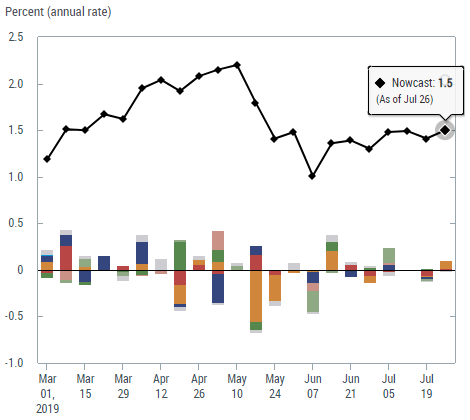
The New York Fed Nowcast estimatefor Q2’19 US GDP isn’t as rosy as economists surveyed by Bloomberg News. Based on the data revisions received thus far about Q2’19, the NY Fed Nowcast is looking for growth at 1.5% after hitting a low of 1.0% in the first week of June.
Pairs to Watch: DXY Index, EURUSD, USDJPY, Gold
USDJPY Technical Analysis: Daily Price Chart (August 2018 to August 2019) (Chart 2)
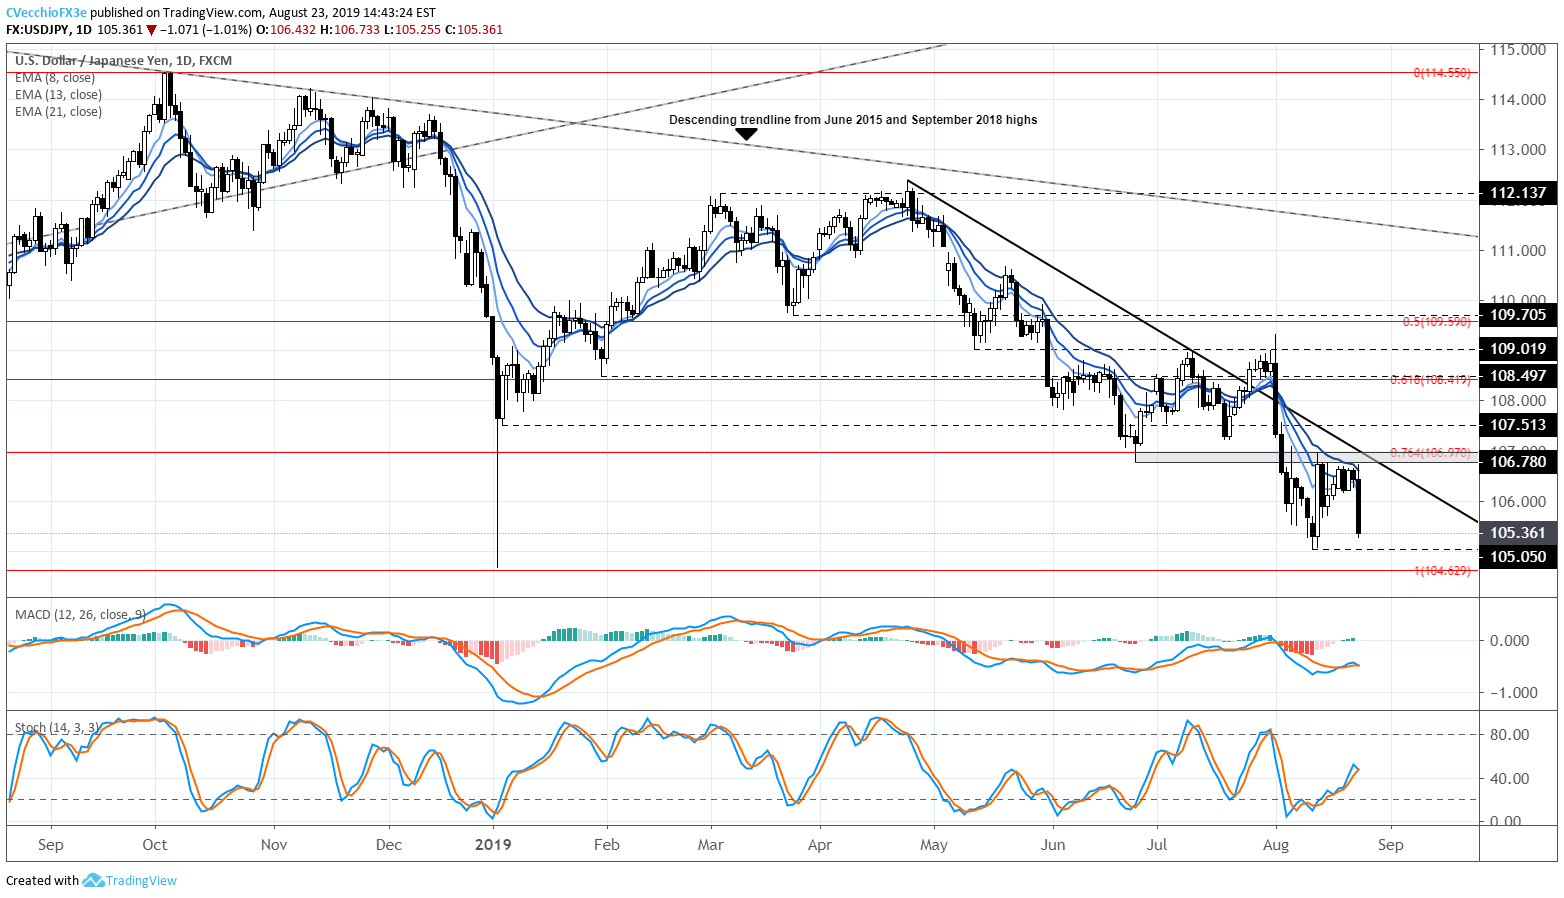
In our most recent USDJPY technical forecast update, it was noted that “with USDJPY trading in lockstep with US Treasury yields, the breakdown to fresh multi-year lows in sovereign bond yields supports a stronger Japanese Yen.” This relationship has not changed in a material way, and the latest drop in US yields has pulled USDJPY lower once more.
It was also noted that, “after USDJPY failed to retake the June low and 76.4% retracement of the 2018 to 2019 high/low range near 106.78/97, it appears that USDJPY is due for a retest of the yearly low at 104.63.” In recent days, price action failed to produce a break above the 106.78/97 zone, and by Friday, August 23, a bearish outside engulfing bar had formed on the daily timeframe.
Accordingly, the path of least resistance remains to the downside. Supporting this view are several overtly bearish technical indicators. USDJPY price remains below the daily 8-, 13-, and 21-EMA envelope, with both daily MACD and Slow Stochastics both issuing sell signals in bearish territory on Friday, August 23. Prior to a retest of the yearly low at 104.63, however, the August low of 105.05 might provide initial support.
IG Client Sentiment Index: USDJPY Price Forecast (August 23, 2019) (Chart 3)
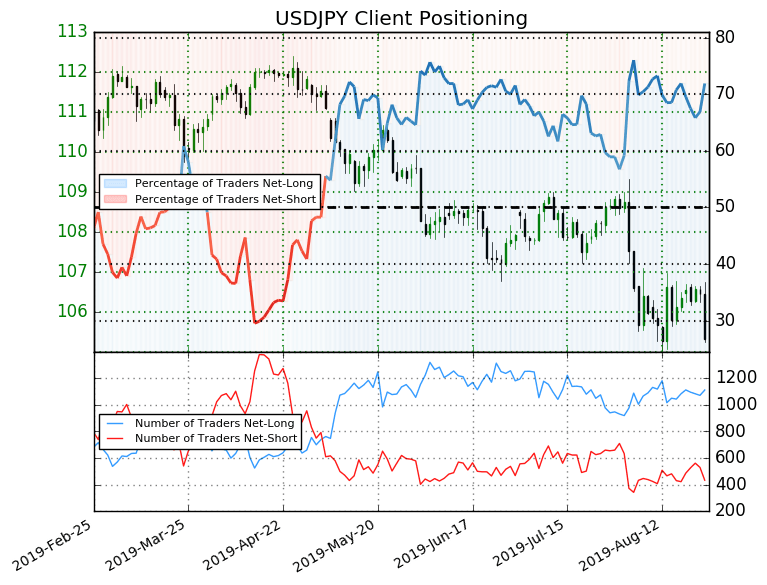
USDJPY: Retail trader data shows 71.9% of traders are net-long with the ratio of traders long to short at 2.56 to 1. In fact, traders have remained net-long since May 3 when USDJPY traded near 111.98; price has moved 5.9% lower since then. The number of traders net-long is 5.0% higher than yesterday and 2.6% higher from last week, while the number of traders net-short is 21.8% lower than yesterday and 4.6% lower from last week.
We typically take a contrarian view to crowd sentiment, and the fact traders are net-long suggests USDJPY prices may continue to fall. Traders are further net-long than yesterday and last week, and the combination of current sentiment and recent changes gives us a stronger USDJPY-bearish contrarian trading bias.
FX TRADING RESOURCES
Whether you are a new or experienced trader, DailyFX has multiple resources available to help you: an indicator for monitoring trader sentiment; quarterly trading forecasts; analytical and educational webinars held daily; trading guides to help you improve trading performance, and even one for those who are new to FX trading.
--- Written by Christopher Vecchio, CFA, Senior Currency Strategist
To contact Christopher, email him at cvecchio@dailyfx.com
Follow him in the DailyFX Real Time News feed and Twitter at @CVecchioFX


