


UK Inflation Talking Points:
- The May UK inflation report (consumer price index) is due on Wednesday, May 22 at 08:30 GMT.
- With oil prices falling more than 20% from their 2019 highs, measures of inflation are being pulled lower across the developed world – the UK included.
- Retail traders are net-long GBPUSD and getting longer, giving us a further bearish GBPUSD trading bias.
Join me on Mondays at 7:30 EDT/11:30 GMT for the FX Week Ahead webinar, where we discuss top event risk over the coming days and strategies for trading FX markets around the events listed below.
06/19 WEDNESDAY | 08:30 GMT | GBP Consumer Price Index (MAY)
With oil prices falling more than 20% from their 2019 highs, measures of inflation are being pulled lower across the developed world – and the UK should not be immune from this emerging trend of disinflationary pressures. According to a Bloomberg News survey, the forthcoming May UK inflation report is due to show headline inflation in at 2% from 2.1% (y/y), while the monthly reading is due in a 0.3% from 0.6%. Core CPI is expected to have eased to 1.7% from 1.8% (y/y).
For any other currency, an inflation report just days ahead of a central bank decision would typically generate a good deal of interest from market participants. But for the British Pound mired by the Brexit saga, the Bank of England has been neutered: so long as the Brexit negotiations are in the works, the BOE won’t act on interest rates. Considering this reality, any Brexit-related developments, particularly those related to the Tory party leadership contest, would quickly supersede any reaction to the May UK inflation report or the June BOE meeting this week.
Pairs to Watch: EURGBP, GBPJPY, GBPUSD
GBPUSD Technical Analysis: Daily Price Chart (December 2017 to June 2019) (Chart 1)
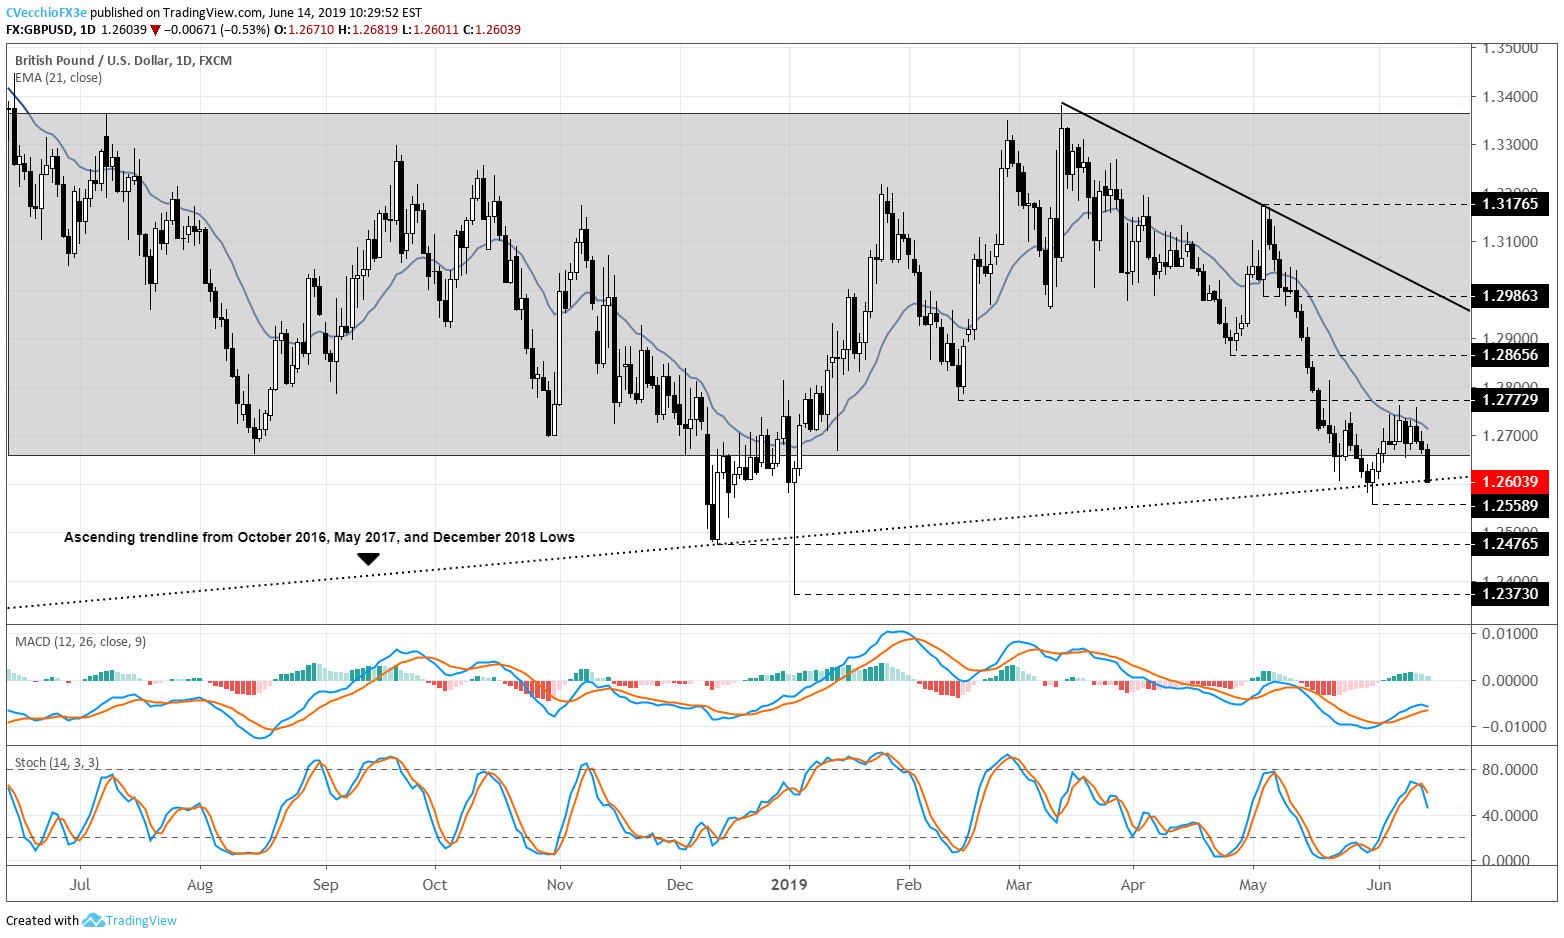
Over the past year, since the bearish outside engulfing bar on June 14, 2018, GBPUSD prices have predominantly traded between 1.2660 and 1.3365, closing within this range 92.2% of the time, or 20 times out of the past 258 trading days.
At a time when the US Dollar’s technical structure has proven increasingly weak in recent weeks, that GBPUSD prices failed to make a recovery back through the daily 21-EMA, the start of June suggests that a bigger decline may be about to take place. Now, the close on Friday, June 14, 2019 – exactly one year after the bearish outside engulfing bar last June – may constitute just the 21st time that GBPUSD prices closed outside of the 1.2660/1.3365 range.
With GBPUSD price holding below the daily 8-, 13-, and 21-EMA envelope, bearish momentum is starting to build. While Slow Stochastics are pointing lower, they are not in bearish territory just yet; on the other hand, daily MACD is in bearish territory already, but hasn’t issued a sell signal. Traders should be on alert of GBPUSD sell signals across momentum indicators in the coming days as price looks ready to break the ascending trendline from the October 2016, January 2017, and December 2018 lows.
On the way down, the April swing low at 1.2559 is in focus at first. Thereafter, the December 2018 low near 1.2477 comes into focus, followed by the January and 2019 yearly low at 1.2373. The emerging bearish bias is appropriate until GBPUSD price closes back above the daily 21-EMA (which hasn’t been done since breaking on May 8).
IG Client Sentiment Index: GBPUSD (June 14, 2019) (Chart 2)
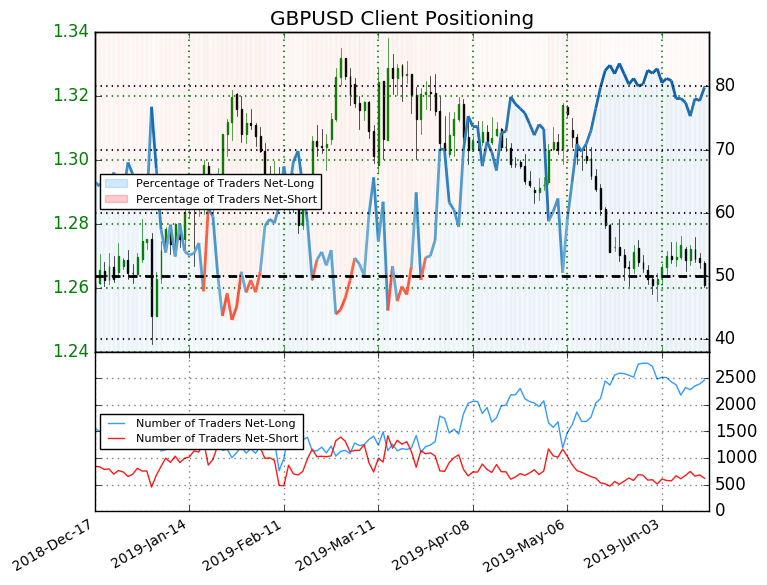
GBPUSD: Retail trader data shows 79.8% of traders are net-long with the ratio of traders long to short at 3.96 to 1. In fact, traders have remained net-long since May 6 when GBPUSD traded near 1.30551; price has moved 3.4% lower since then. The percentage of traders net-long is now its highest since June 6 when GBPUSD traded near 1.2697. The number of traders net-long is 0.2% lower than yesterday and 2.5% higher from last week, while the number of traders net-short is 15.6% lower than yesterday and 14.2% lower from last week.
We typically take a contrarian view to crowd sentiment, and the fact traders are net-long suggests GBPUSD prices may continue to fall. Traders are further net-long than yesterday and last week, and the combination of current sentiment and recent changes gives us a stronger GBPUSD-bearish contrarian trading bias.
FX TRADING RESOURCES
Whether you are a new or experienced trader, DailyFX has multiple resources available to help you: an indicator for monitoring trader sentiment; quarterly trading forecasts; analytical and educational webinars held daily; trading guides to help you improve trading performance, and even one for those who are new to FX trading.
--- Written by Christopher Vecchio, CFA, Senior Currency Strategist
To contact Christopher, email him at cvecchio@dailyfx.com
Follow him in the DailyFX Real Time News feed and Twitter at @CVecchioFX


