


Talking Points
-Head winds holding down risk flows for Dow Jones Industrial Average (DJIA)
-Wait for a break of 18,450 (for long) and 17,903 (for shorts) to mark off key levels to determine the short term trend
-This is a shorter term outlook for DJIA; Download our quarterly forecast for a longer term equities forecast.
With cooler weather embracing United States and the Fall Classic (baseball playoffs) making its way to the television, will this fall season produce a ‘fall’ in Dow Jones Industrial Average? Seasonally, September and October are rough on equity markets and this year appears no different.
Dow Jones Industrial Average has been unable to offer a meaningful rally since the mid-September swoon. That price action hints at the potential for lower prices coming.
If you recall, back on September 9, DJIA fell 2.2% in the day alone. Subsequent price action has been choppy and the dip in prices has not drawn investors in to “bottom fish”.
There are a couple of headwinds creating nervousness among traders. First, Deutsche Bank is trying to process through its recent challenges. Secondly, the Fed is trying to create a façade of potential rate hikes. Market participants aren’t exactly buying into the Fed producing rate hikes, but the chatter on the topic is a constant reminder of higher costs of capital in the future.
Specifically, regarding DJIA price action, we previously wrote how 18,450 and 17,903 were key levels to watch. Neither price level has been broken yet. We are leaning towards an eventual break down in price as the upward movement from September 12 appears corrective. Therefore, traders can look for higher prices to establish short positions or wait for a break below 17,903.
One possible pattern is a triangle forming. It would be a bearish triangle and suggest a couple more days of sideways which would lead to a bearish sell off. In this scenario, prices would hold below 18,450 on their way towards 17,000.
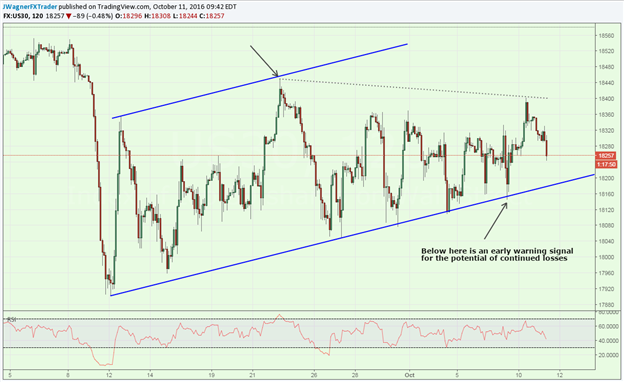
Looking at a smaller time framed chart, a move below 18,146 may be an early warning signal for continued losses as prices would be falling outside of this blue trend channel. A continued break down below 17,903 would signal additional losses are probable. If prices do break down, we’ll consider lower levels to eventually buy a dip. If that happens, we’ll fine tune the pricing later, but for now the general area of dip buying is near 17,000.
If you are interested in what the shorter term momentum looks like as DJIA approaches either 18,450 or 17,903, check out our GridSight Index. (Change the chart setting from “EUR/USD” to “US30” on either “m5” or “m10”.) The GSI is a big data indicator that analyzes what past patterns and how they have historically developed.
---Written by Jeremy Wagner, Head Trading Instructor, DailyFX EDU
Follow me on Twitter at @JWagnerFXTrader .
See Jeremy’s recent articles at his Bio Page.
To receive additional articles from Jeremy via email, join Jeremy’s distribution list.


