


Talking Points
-Dow Jones Industrial Average (DJIA) gaps lower, but price volatility has been muted all week
-Support levels loom near 18,295 and 18,000 for bullish traders to buy the dip
- GridSight Index can offer clues about short term momentum for day traders
Dow Jones Industrial Average gapped lower today. However, it was a lackluster week and a forgettable week for Dow Jones Industrial Average trading. DJIA closed last week at 18,491 and its CFD (US30) is trading near 18,340 as we write. A snoozer of a 0.8% weekly move.
The first week of September marks when the students go back to school and traders return from summer holiday. However, the quiet trading of this week hints that the summer holiday time was extended.
Though Fed rate hike expectations have waffled a little this week, the market has not responded to those vibrations. As a recap, leading up to last Friday’s Non-Farm Payroll report, Fed Fund futures were pricing in 34% chance of an increase in September and 60% chance of an increase in December. On Tuesday, those expectations dove as a result of the weak NFP report. As of this morning, those expectations are at levels we saw last week with a 34% chance of an increase in September and 61% chance of an increase in December.
Therefore, expectations are still somewhat elevated for the possibility of a Fed rate hike prior to the end of 2016.
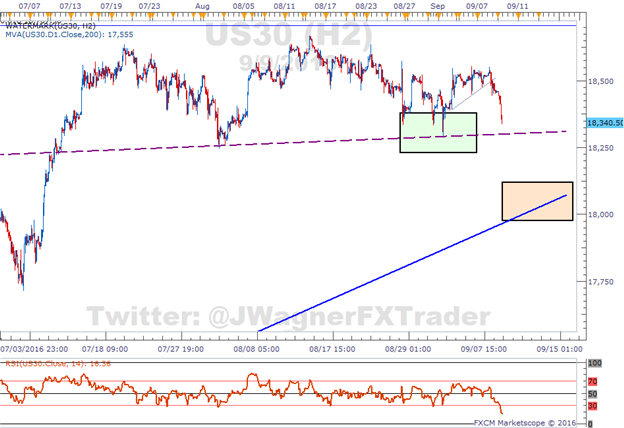
Chart prepared by Jeremy Wagner
DJIA doesn’t appear committed one way or the other based on those expectations. The resulting price movements for DJIA this week have yielded a trading range of 18,551 to today’s gap lower near 18,340. We are finally approaching a key level where traders can position for a positive risk to reward ratio opportunity. 18,295 represents last Thursday’s low which also coincides with the dotted purple line on the chart. This level represents support.
If the 18,295 level holds, then it suggests more sideways to higher trading. However, if this level breaks, then it opens the door to lower levels near 18,000. Therefore, bullish traders will get a couple shots to buy the dip on lower trade to near 18,295 and possibly 18,000.
Our medium term bias remains to the upside as the patterns call for higher prices towards 19,700.
A trader can use the GridSight Index tool to see how the short term price patterns are behaving. This is helpful when price is approaching levels of support or resistance to give a clue if the levels are doing to hold.
Interested in a longer term outlook for equities? Download our quarterly forecast here.
---Written by Jeremy Wagner, Head Trading Instructor, DailyFX EDU
Follow me on Twitter at @JWagnerFXTrader .
See Jeremy’s recent articles at his Bio Page.
To receive additional articles from Jeremy via email, join Jeremy’s distribution list.


