


Talking Points
-Dow Jones Industrial Average (DJIA) closes up 5 days in a row to new all-time highs
-Fed rate hike expectations still low near 42% for December 2016
-Anticipating a continued move towards 19,700-20,000
Dow Jones Industrial Average closed up 5 days in a row which brings the 3 week gain to 6%. The fundamental driver has been lowered rate hike expectations which tend to favor equities. Fed rate hike expectations show 42% chance of a hike in December 2016 which is still quite low.
The price action for the past 3 weeks does support the outlook for further gains as it appears we are in a small degree 3rd wave. Third waves tend to be the longest and strongest of the 5 wave Elliott Wave sequence. Since the first wave printed from February 11 to April 20 and gained about 17%, we can anticipate this current wave from the June 27 low to gain in excess of 17% placing initial targets near 20,000.

Chart prepared by Jeremy Wagner
Though the forecast is for higher prices, we also need to consider price points where other lower probability patterns may suppress those bullish opportunities. There are some wave relationships that show up in US30, a CFD which tracks the DJIA, from 18,575-18,700. This price zone could offer some resistance.
However, let’s be clear, the trend is higher so we do not want to initiate short positions. The 18,575-18,700 price zone may buffer increases and if they do completely reject prices lower, then we’ll begin to consider other alternate patterns.
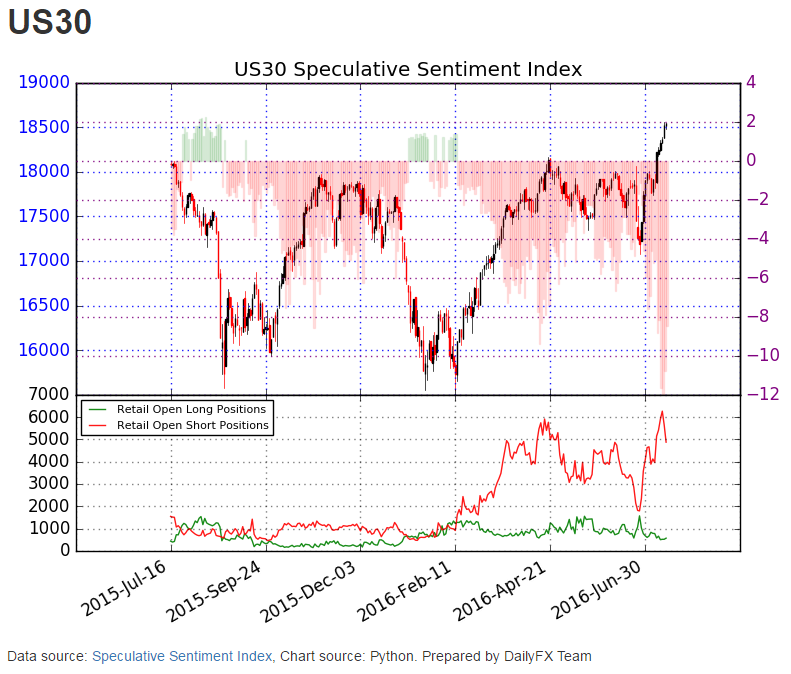
From a sentiment perspective, 10% of the retail traders are positioned long as indicated through the Speculative Sentiment Index. Typically, SSI is a contrarian indicator and suggests more gains are coming for US30.
The risk to the immediate bullish view can be placed near the June 27 low of 17,060. A short bias can be activated near 15,503.
Suggested Reading: Dow Jones Industrial Average Punches Back After Brexit Collapse
Interested in a longer term outlook for equities? Download our quarterly forecast here.
Having trouble with your trading? Check out our Traits of Successful Traders research.
---Written by Jeremy Wagner, Head Trading Instructor, DailyFX EDU
Follow me on Twitter at @JWagnerFXTrader .
See Jeremy’s recent articles at his Bio Page.
To receive additional articles from Jeremy via email, join Jeremy’s distribution list.


