


Talking Points
-Dow Jones Industrial Average (DJIA) breaks above 18,167 and tests all-time highs
-Fed rate hike expectations still low near 30% for December 2016
-Anticipating a continued move towards 18,575 and 19,700
Dow Jones Industrial Average continued its winning ways with 7 out of the past 9 trading sessions closing higher. Today’s action is poised to open higher as well as futures are pointing to about a 0.4% gain. Over the weekend, Japan’s ruling party secured enough seats that opens the door for the government to launch fiscal stimulus measures. The Japanese Yen has been selling off hard as well (USD/JPY moving higher) which is indicative of a risk on mood.
Additionally, the change up in the PM position for UK is closing the door on one piece of uncertainty. The markets can begin to deal with the next chapter of the Brexit drama. Interest rate hike expectations from the Fed continue to be muted with only a 30% probability of a rate hike in December 2016. This is fueling positive risk on sentiment for equities.
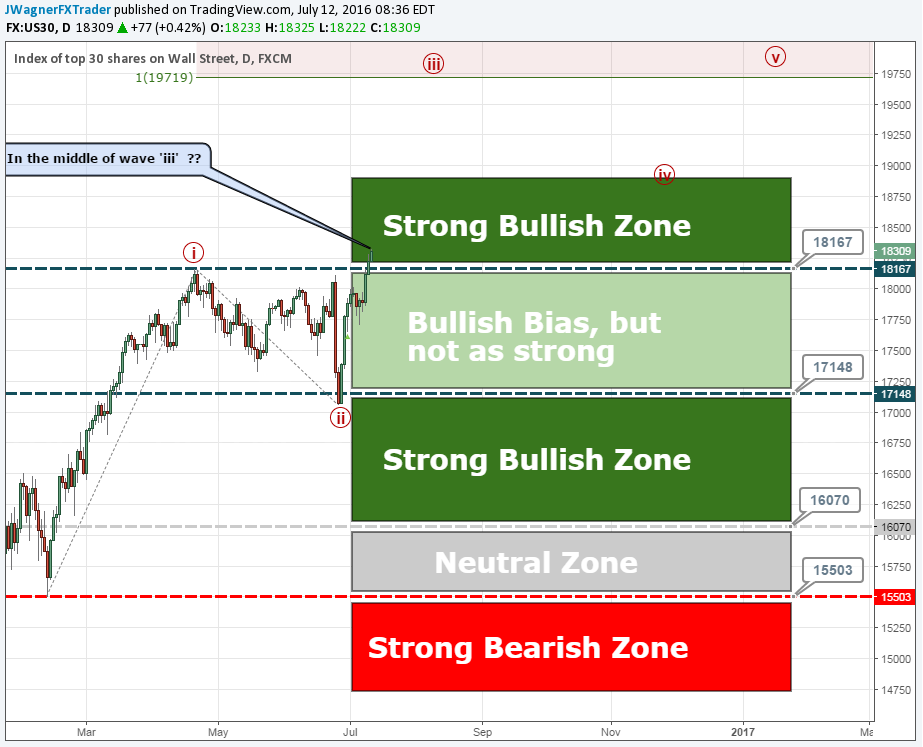
We’ve been highlighting for the past 2 weeks how the technical patterns for US30, a CFD which tracks the DJIA, is are bullish. The break higher above 18,167 does activate a strong bullish outlook as it appears we are in a 3rd wave higher in Elliott Wave terms. Third waves tend to be the longest and the strongest. If this is indeed the pattern (and we’ll never know for sure until after the waves are completed), then much higher prices are ahead.
There are a couple of wave relationships that we’ll keep an eye on for resistance. The first is 18,575. If prices have a difficult time pressing above this level, then we need to be cautious for stronger dips.
The next level of measured resistance comes into play near 19,700. We are anticipating a larger struggle taking place near here if DJIA continues to rise from current prices.
The risk to the immediate bullish view can be placed near the June 27 low of 17,060. A short bias can be activated near 15,503.
Suggested Reading: Dow Jones Industrial Average Punches Back After Brexit Collapse
Interested in a longer term outlook for equities? Download our quarterly forecast here.
Having trouble with your trading? Check out our Traits of Successful Traders research.
---Written by Jeremy Wagner, Head Trading Instructor, DailyFX EDU
Follow me on Twitter at @JWagnerFXTrader .
See Jeremy’s recent articles at his Bio Page.
To receive additional articles from Jeremy via email, join Jeremy’s distribution list.


