


Talking Points
-Dow Jones Industrial Average (DJIA) nears measured resistance of 18,000
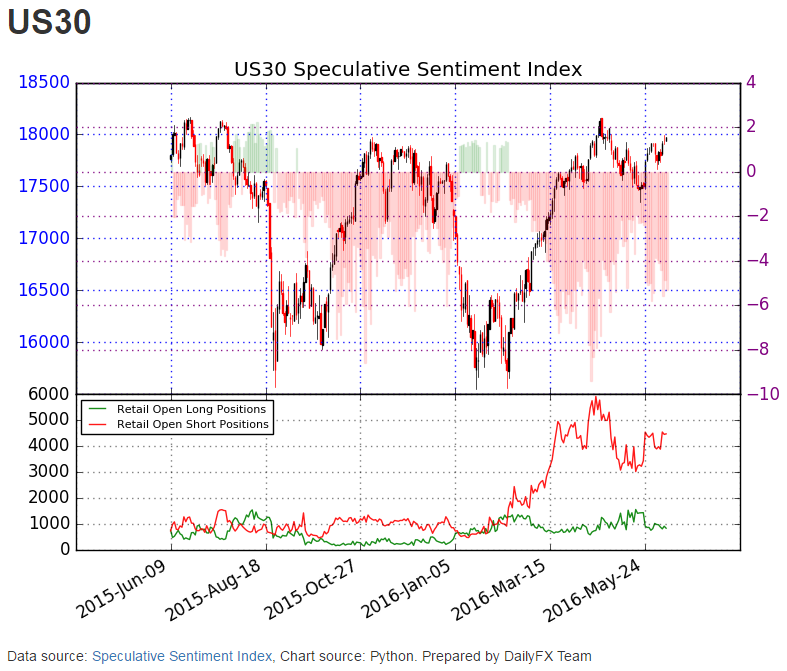
-Use Sentiment to confirm a successful break higher as SSI sits at -5.2
-Considering buy the dip strategy on moves back towards 17,300
After a surprisingly weak jobs report on Friday, rate hike expectations are plummeting. As of today, there is no expectation of a hike coming June 15. Fed Fund futures is projecting only an 18% chance of a hike in July. The next meaningful estimate for a hike comes after US presidential elections in December.
Fed watchers seem to be toggling between a ‘hike on’ or ‘hike off’ with each data point release. Currently, the mood is switched to ‘hike off’. This is providing a back drop for DJIA to drift higher.
In previous reports, we’ve mentioned how the market has been disbelieving of a summer rate hike. That disbelief has transferred into the technicals as dips have been relatively shallow.
We are beginning to reach a cross roads where prices could accelerate higher or provide a little shake out lower prior to another bull run.

In our last report, we identified 17700-17730 as a potential support zone to buy US30, a CFD which tracks the DJIA. Prices did dip to about 17,662 and appear to be moving higher in a smaller degree fifth wave. There appears to be resistance in the 18,000-18,075 price range. The divergence on RSI is consistent with a small degree 5th wave interpretation.
Sentiment, measured through the Speculative Sentiment Index (SSI), is providing bullish signals as it sits at -5.2. Over the past week, the number of short traders has increased 22% while the number of long traders has fallen 25%. SSI is a contrarian type of indicator such that when more traders are bearish, then we want to look bullish.
Learn more about Speculative Sentiment Index by downloading the SSI guide and watching this 5 minute “Introduction to Sentiment” video.
In conclusion, if we see price moving into the 18,000-18,075 zone cited above with SSI moving below -5.2, then we have the potential for a breakout higher. Look for SSI to confirm the break.
Otherwise, we could see US30 drop down towards 17,300. Under both scenarios, we are still biased to the bull side. It becomes of question of breaking out higher now or buying the dip later.
This is a medium term outlook for US30. For a quarterly outlook on equities, download our equities forecast.
Suggested Reading:
Using Elliott Wave Theory EUR/GBP is Near Support
Will a 5th EUR/USD Sentiment Flip Follow the Path of the Previous 4?
Quarterly Forecast, Equities [Free Download]
---Written by Jeremy Wagner, Head Trading Instructor, DailyFX EDU
Follow me on Twitter at @JWagnerFXTrader .
See Jeremy’s recent articles at his Bio Page.


