


Talking Points
-Dow Jones Industrial Average (DJIA) bursts higher after correcting for 5 weeks
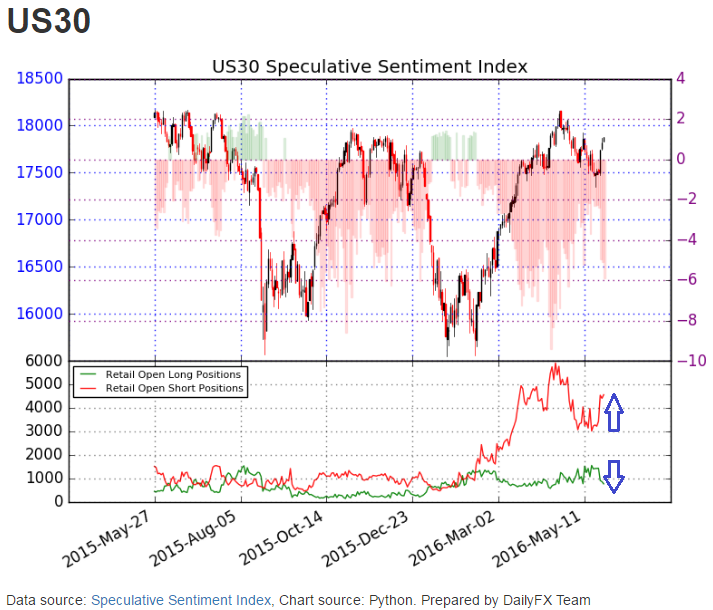
-Sentiment confirms a successful break higher as SSI reaches -5.8
-Considering buy the dip strategy on moves back towards 17,700-17,730
After consolidating and correcting lower for 5 weeks, DJIA sprung higher for triple digit gains in 2 consecutive days.
We mentioned in Monday’s report how the corrective structure “points to higher prices which is consistent with the market’s current disbelief of a summer rate hike.” Though we were looking for a slightly larger dip, prices did break above the purple trend line which was a trigger for bulls.
Additionally, sentiment evidenced through the Speculative Sentiment Index (SSI), plummeted to -5.8. Traders positioned long have plummeted 50% below levels seen last week. Traders positioned short have increased 45% above last week’s levels (see sub-chart below). This behavior from the sentiment gauge is consistent with a breakout as sentiment is used as a contrarian type of indicator.
Learn more about Speculative Sentiment Index with this 5 minute video.
In Monday’s report, we also noted “if prices break above the purple resistance line, then we’ll reconsider the probability of the tradeable low being in place.”
Based on the confirmation from SSI above, we can conclude this environment is a buy the dip type of market. Dips into 17,700-17,730 will look to be bought.
After a clean break, many times prices come back to retest the point of breakout. When we look at the chart for US30, a CFD which tracks the DJIA, we’ll look for a retest to the topside of the purple trend line for a signal to buy the retracement which is in the price zone cited above.
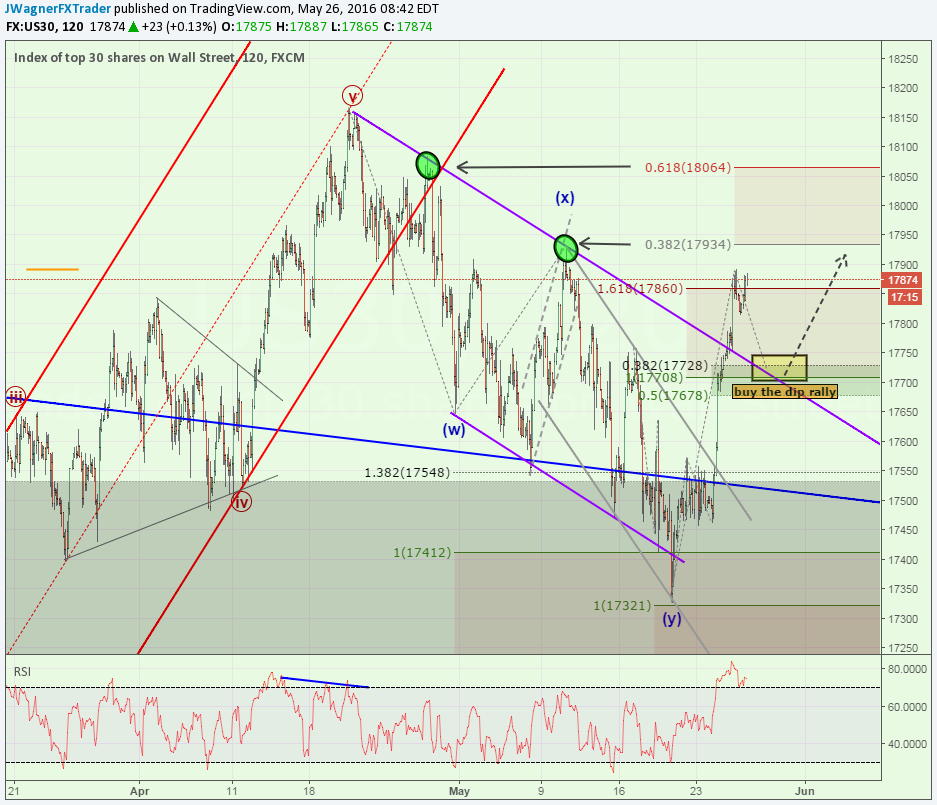
The risk can be placed at Friday’s high near 17,570. Initial target levels are 17,934 and 18,064 with potentially higher levels according to Elliott Wave Theory. This provides a positive risk to reward ratio which we found to be one of the traits of successful traders.
On a side note, notice when you compare the target level to the price action on the left side of the chart, those prices match up with previous swing highs. If US30 gets to those zones, we may see a reaction lower. However, a clean break above those levels may open the door to a more powerful break higher.
The above is a shorter term forecast for Dow Jones. If you are interested in our Q2 2016 equities forecast, download it here.
Suggested Reading:
Gold Price Falls Hard as Rate Hike Expectations Intensify
Will a 5th EUR/USD Sentiment Flip Follow the Path of the Previous 4?
---Written by Jeremy Wagner, Head Trading Instructor, DailyFX EDU
Follow me on Twitter at @JWagnerFXTrader .
See Jeremy’s recent articles at his Bio Page.
Check out the latest standings for the FXCM trading contest HERE.


