


Talking Points:
- The Benefits of Elliott Wave
- The Characters Of Each Wave
- Allow MACD To Help You Start In The Middle
“We’re in the business of making money, not creating an ideal wave count...”
-Constance Brown
There is a lot of allure to having the market perfectly mapped WITH AN thorough Elliott Wave count. However, the Elliott Wave principle brings a lot of people under something called hindsight bias. Hindsight bias, is the mental bias that hurts traders where they look back on a completed price chart and feel that they were more predictable than they really are in real time.
Learn Forex: A Clear Elliott Wave Count Can Bring Confidence
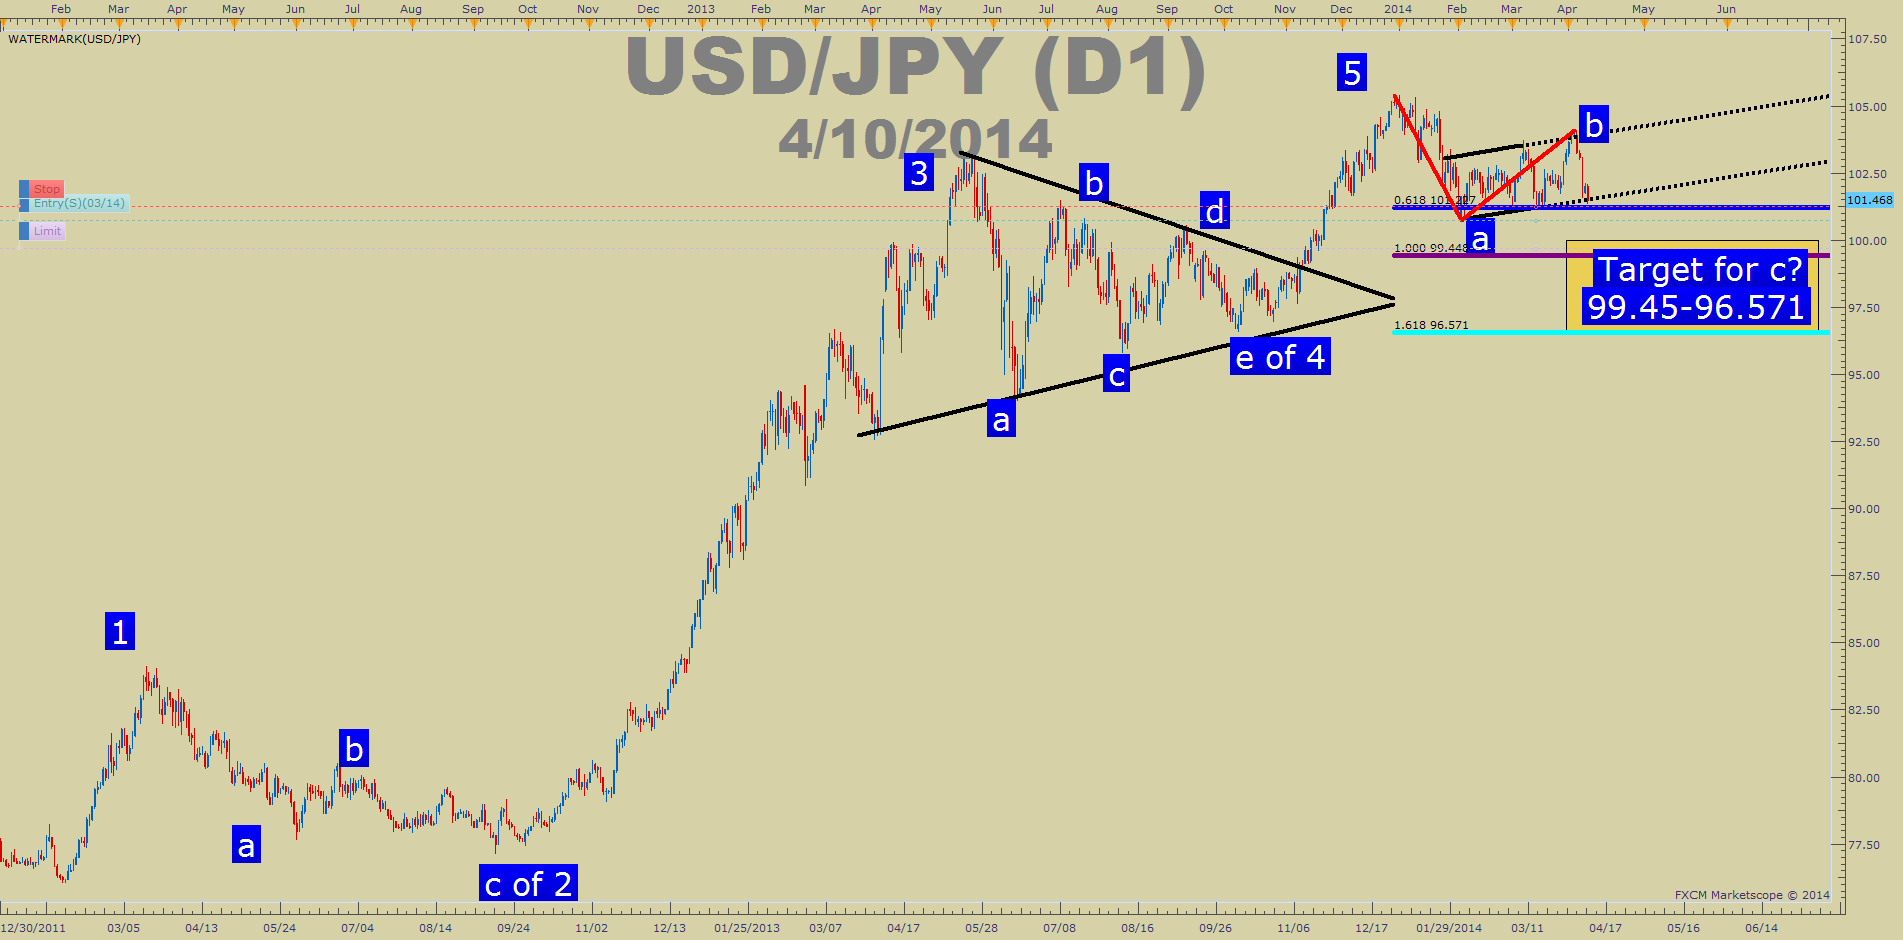
Chart Created by Tyler Yell, CMT
The Benefits of Elliott Wave
Few tools are as helpful in allowing you to put the context of a current market move into an overall trend like Elliott Wave. The concept is that in freely traded markets, human behavior will often act in 13 repeatable patterns. The analysis of these patterns will allow you to look at the possibilities of upcoming price action probabilities.
Having a probable understanding of price action probability is a huge benefit. Another benefit is that Elliott wave can help you time the market by recognizing likely end points of a counter-trend move, also known as a correction. Lastly, through the use of Fibonacci tools, Elliott traders can forecast potential price targets which are great for knowing when to get out of an uptrend on strength.
The Characters of Each Wave (New Bull Trend Example)
In its simplest form, moves in the direction of the trend unfold in 5-waves and counter-trend moves happen in 3-wave structures. Moves in the direction of the trend will be numbered on the chart and called impulse waves. Moves against the trend will be called correction and are lettered below.
Basic / Idealized Elliott Wave Structure

Chart Created by Tyler Yell, CMT
To help you see what the common character of each wave is, here is a quick description of each of the 8-waves. The purpose of this is so you will know with higher probability, if you’ve labeled the charts correctly so that you can anticipate the next likely move. After this breakdown, you will see how we can use MACD to clearly recognize Wave 3 so that you can pinpoint corrections.
Wave 1: Basing move, price is moving higher even with bad news, seen as noise off the trend
Wave 2: Retraces most if not all (100%) of Wave 1. Many convinced the bear trend is back
Wave 3: Most Powerful wave and where you’ll learn to begin your count soon. Very strong.
Wave 4: Corrective Wave that will be different than Wave 2 and stall excitement of Wave 3.
Wave 5: Much less powerful than Wave 3, Technical Divergence is often seen here
Wave A: Key correction, will tip you on what type of correction to expect, can be 5 or 3 waves
Wave B: Known as the “Suckers rally”, fake return of prior trend which fails to Wave C
Wave C: The corrective sibling of Wave 3. Aggressive move down, often surpasses Wave A Low
Allow MACD to Help You Start in the Middle for Better Counts
This is the most helpful Elliott Wave lesson I’ve learned and it’s thanks to Constance Brown in her book, Technical Analysis for the Trading Professional. The concept that she did a great job of recognizing is that the third wave of an impulse is easiest to see via an oscillator. She is a whiz with RSI and usually works with that oscillator but MACD also does a very good job of clearly showing you a third wave whether in a bullish or bearish trend
Learn Forex: MACD Clarifies the Elliott Wave Picture
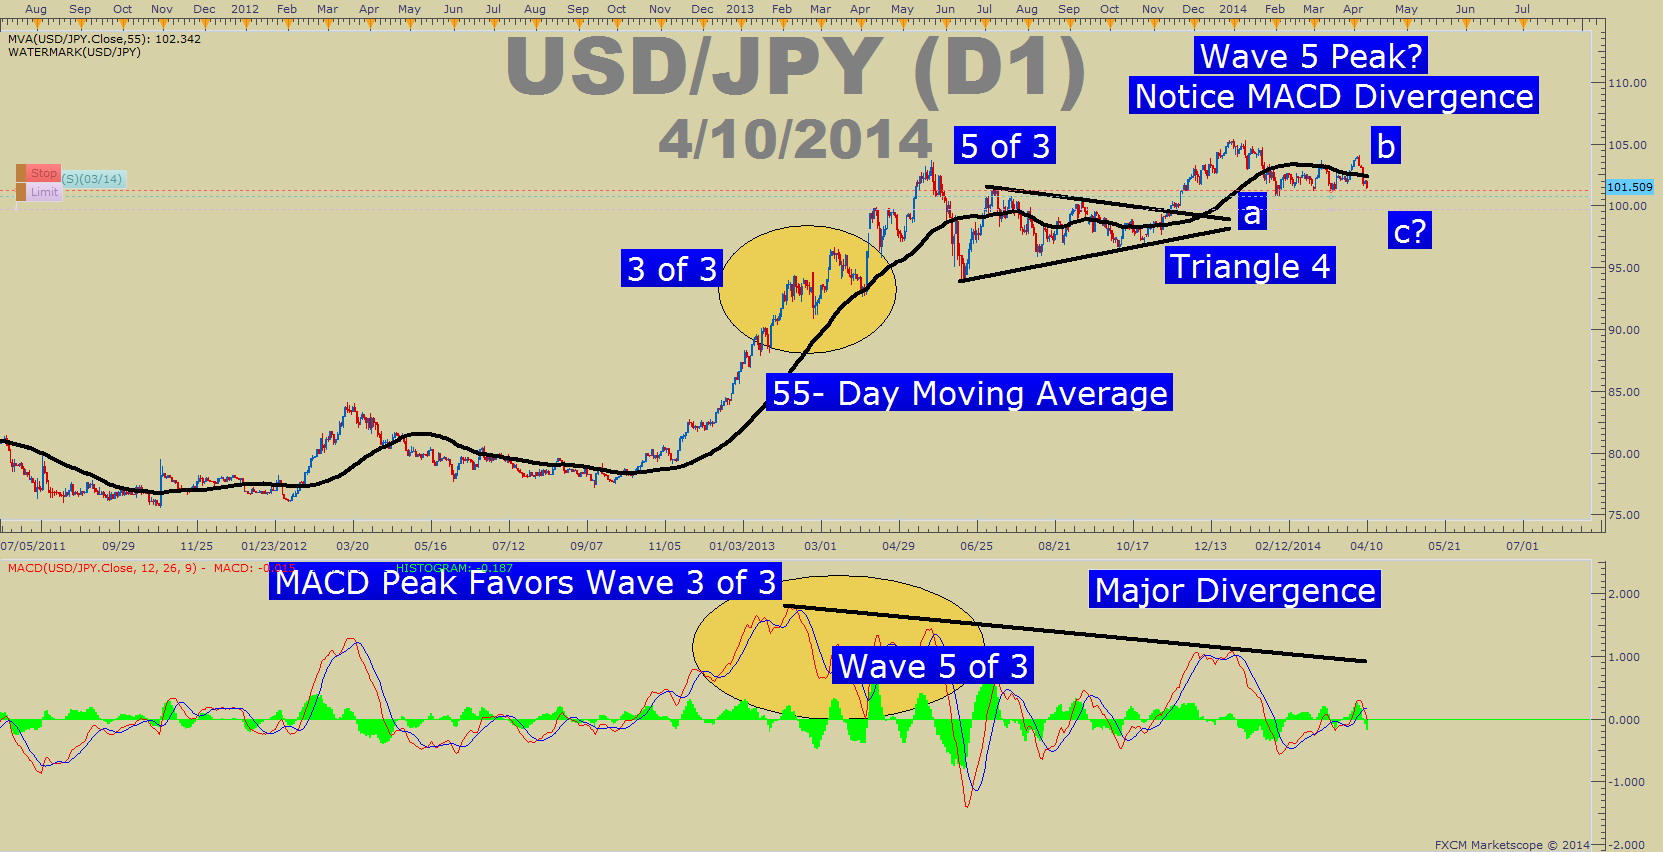
Chart Created by Tyler Yell, CMT
In the end, you’re really looking for MACD peaks and MACD divergence to clarify the Elliott Wave count. You don’t have to have the perfect count, which should be a relief as it was for me. You simply need to identify the 3rd wave of Wave 3 with the largest peak and then use divergence to identify wave 5. Once those are identified, you’ll be in a position to trade the turn or the resumption of the trend.
Happy Trading!
--Written by Tyler Yell, CMT
Interested In Our Analyst's Best Views On Major Markets? Check Out Our Free Trading Guides Here


