


Talking Points
-EURUSD Uptrend since June 2012 Looks Tired
-Elliott Wave is shows a potential Rising Correction near Exhaustion
-The Key Technical indicators That Point to 1.3550 As Critical Support
Even if the Forex market is full of interesting set-ups in USDCAD or other less discussed pairs, no trader wants to be without a grasp of EURUSD. After all, EURUSD houses the currencies of the two largest global economies and the capital flow alone between these two is like no other FX Pair out there. Recent price action has left many traders feeling like this pair will never drop below 1.3500 again but a few technical developments could begin to shift the overall bias firmly to the downside.
EURUSD Uptrend Since June 2012 Looks Tired
Learn Forex: EURUSD Move Hire Is Corrective Under 2008 Trendline
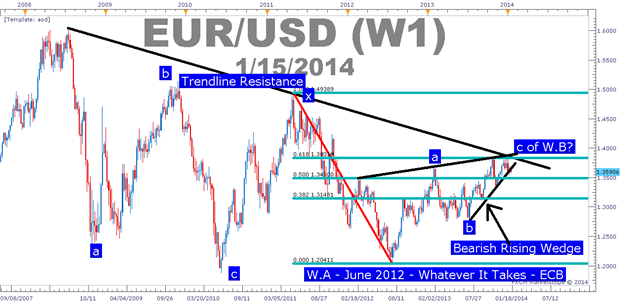
Presented by FXCM’s Marketscope Charts
The EURUSD chart above should show you a few things. First, since 2008 when EURUSD topped off at 1.60369 only to drop by 3,700 pips in 15 wild weeks in 2008-2009 down to 1.2389, the pair hasn’t made must progress in either direction. Second, if you’re comfortable with the Elliott Wave Principle, you can see that this lack of progress with labels attached describing the last 5-years of price action as corrective in nature or put another way, trend ready. Third, the trendline drawn from the highs of 2008 & 2011 show price is pushing into resistance whereas a break to the topside would be very bullish and bring EURUSD to the mid-to-upper 1.4000s or if the chart trendline is honored then the next big figure to crack will be 1.3000 on the downside rather than 1.4000 on the topside.
Elliott Wave Is Showing a Potential Rising Correction About To Turn Lower
If you’re new to Elliott Wave, the first misconception that should be cleared up is that Elliott Wave brings about absolute certainty in any future market move. In fact, Elliott Wave is a great way to the probabilities of different price action possibilities. However, to prevent you from jumping in front of a move, it’s often helpful to have price triggers to see that your analysis may in fact be unfolding as you presumed it would. Of course, as discussed in The Truth Of Trading, what’s more important is that you have identified key points where you analysis is deemed incorrect so as to get you out of a trade so that you’re not riding a trade on hope alone.
EURUSD Elliott Wave Shows Probability for Lower Price Action

Presented by FXCM’s Marketscope Charts
Within Elliott Wave, the market is either moving in two directions, impulsive or corrective. As the name implies, an impulsive move is one that will usually occupy the headlines of DailyFX as it signifies a stronger trend relative to past price action on the pair. The antithesis of an impulse is a corrective move. A corrective move, is sluggish in character and will often unfold in 3-waves against the trend within a Fibonacci relationship. As you can see above, the current top, although only time will tell us if it is ‘the top’ for now, is 0.618% of 2011-2012 range in EURUSD.
Learn Forex: Fibonacci Expansion Targets Show EURUSD Has the Potential to Move Much Lower

Presented by FXCM’s Marketscope Charts
Beyond understanding corrective price action, Elliott Wave is useful in helping us gauge potential price targets through Fibonacci Expansions. The more common expansions that are sought to define price targets are the 61.8% expansion (where the second impulse travels 61.8% of the first impulse), 76.4%, 100%, 127.2% & 161.8%. As a trader who prefers to look for confluence, when a Fibonacci retracement aligns with a Fibonacci expansion, then you have a higher degree probability profit target. On this long-term chart with Monthly Oscillators displayed, you will recognize 3 different Fibonacci level confluences.
The Key Technical Indicators That Point To 1.3550 as Critical Support
Now that you’ve seen what’s possible as according to Elliott Wave and Fibonacci targets, let’s discuss some technical levels that will need to give before this view of a major leg lower takes form. As a Trader of any market, it’s helpful to see a building up of your trading idea through breaks of support in an impulsive downtrend or resistance in an uptrend. With respect to EURUSD, the initial level that will need to give to begin the bearish / selling argument is 1.3530.
Learn Forex: The Many Indicators Pointing to the Importance of 1.3550/30 as Support
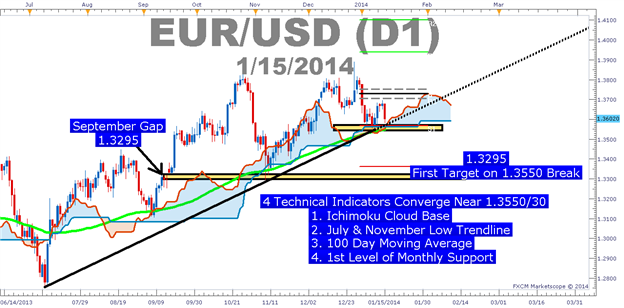
Presented by FXCM’s Marketscope Charts
Once again, the breaking of the 1.3550 level only contributes to the arguments that the price touched on Dec. 27th of 1.3895 may in fact be a top but does not guarantee it. Therefore, the next key question to ask would be, “If this level gives way, where should I place a stop to protect me from upside risk?” To answer that question, it is best to look at the most recent pivot in price which took place near the 21-day moving average which is currently at 1.3675.
Closing Thoughts
EURUSD has the potential to be another big mover off the back of the potential US DOLLAR comeback. As EURUSD makes its way out of the 2014 opening range, a break below 1.3550 as discussed in this article could bring an opportunity for lower prices but to keep our risk under control, you should look to keep a stop around the nearest lower high in price around 1.3675.
Happy Trading!
---Written by Tyler Yell, Trading Instructor
To contact Tyler, tyell@dailyfx.com
To be added to Tyler’s e-mail distribution list, please click here.
As a dedicated FX Trader, would you like the following?
- Faster access to fundamental releases that is likely to move the markets
- Feedback on market movements in real time
- Real time Speculative Sentiment Index Readings
- Free One-Day Unlimited Access Trial Available Here
If so, our Real-Time DailyFX on Demand is a fee based service that gives you access to our professional trading staff from 6am – 2pm ET Every trading day so you can get feedback on your trade setups and ideas and stay abreast of key market views and news the causes FX to move..


