


Talking Points:
-Extreme SSI reading suggests further losses for USDOLLAR
-USDOLLAR carves bullish equal wave pattern
-Use breakout to determine which force wins and thus which direction to trade the Greenback
This week saw major emotions and anxiety increase as the United States government shutdown begins its second full week. There are technical indicators suggesting the USDOLLAR may continue its recent sell off. On the other hand, there is a bullish pattern suggesting the USDOLLAR could rally on a debt ceiling agreement.
This piece will guide you on some key levels to watch to see which pattern is playing out.
Forex Strategy: Matching Strong versus Weak
| Currency | Up Arrows | Down Arrows | Change From Last Week |
|---|---|---|---|
| NZD | 7 | No Change | |
| AUD | 6 | 1 | Higher 1 ranking |
| CHF | 4 | 2 | Down 1 ranking |
| EUR | 4 | 2 | Higher 1 ranking |
| GBP | 2 | 4 | Down 2 rankings |
| JPY | 2 | 4 | No Change |
| USD | 1 | 6 | Higher 1 ranking |
| CAD | 7 | Down 1 ranking |
Chart created by DailyFX EDU Robert Warensjo
Using forex analysis, we find see in the chart above how the USD has been relatively weak against its other main counterparts. In fact, the USD has occupied one of the bottom 3 spots since September 22 Strong & Week report.
The biggest technical indicator suggesting the dollar sell off may continue is FXCM’s Speculative Sentiment Index (SSI).
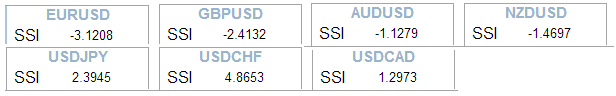
FXCM’s Speculative Sentiment Index (SSI)
The SSI shows the majority of traders are currently long the USDOLLAR. SSI is a contrarian indicator which suggests the Dollar is likely to sustain additional losses. Since the majority of traders have already bought the Dollar, then they become a future pool of potential sellers when they decide to close out their trade. This emotion is likely accelerated if they are in a losing position.
Forex Education: USDOLLAR Equal Wave Pattern?
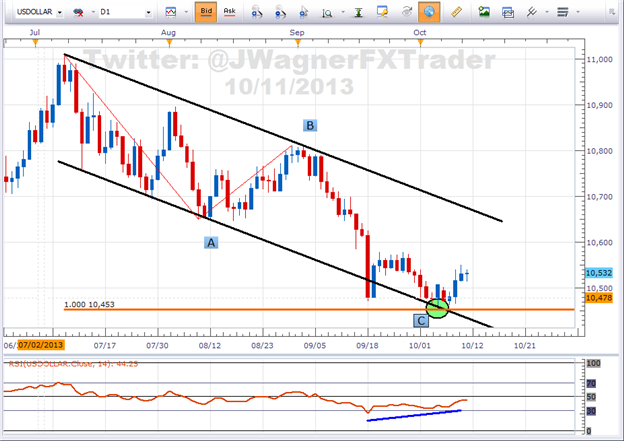
(Created using FXCM’s Marketscope 2.0 charts)
On the other hand, there is a bullish pattern displayed on the Dow Jones FXCM Dollar Index. In the chart above, wave c equals the length of wave at near the 10,453 price. With prices trading sideways for the past 3 weeks, perhaps the Dollar is trying to put in a bottom.
Additionally, the Relative Strength Index (RSI) is showing a sign of divergence which simply means the momentum to the downside is running out of fuel. Combined with the RSI divergence, we can time reversals using the equal wave pattern. This has the potential to be a powerful pattern if it develops. It is possible the whole pattern equal wave pattern is likely to be retraced toward 11,000 at some point in time in the future.
(To learn more about trading with the RSI, enroll for this free RSI course and receive a sample RSI strategy at the end. The course will take about 20 minutes to complete.)
How do we know which way to trade the Dollar?
At this point, there are logically technical reasons to suggest both sides. Therefore, let price action dictate to you when prices are reason to commit to one direction. The easiest way to determine is wait for price to break above resistance or below support.
Most market participants are expecting a resolution to the US debt ceiling debate. However, there is the potential for collateral damage done in the markets through reduced confidence in politician’s ability to quickly resolve difficult situations.
For example, if the resolution is a 6 week extension, how does that really solve anything? After all, the October 17 time line has been in place for several months. My point is that a 6 week extension may erode the confidence of market participants and they begin to hedge for a safety play.
We won’t know until the news is released how traders will react. Therefore, we feel the best way to trade the Dollar is through a currency basket where you are trading a currency rather than a pair.
So here’s the plan, wait for the 10,455 - 10,580 range to break. If price breaks above 10,580, then buy the USD Basket. If price breaks below 10,455, then sell the USD basket. The opportunity can be traded by placing a USD currency basket trade through FXCM’s Mirror Trader platform.
Good luck with your trading!
---Written by Jeremy Wagner, Head Trading Instructor, DailyFX Education
Follow me on Twitter at @JWagnerFXTrader.To be added to Jeremy’s e-mail distribution list, click HERE and select SUBSCRIBE then enter in your email information.
See Jeremy’s recent articles at his DailyFX Forex Educators Bio Page.
Obtain SSI updates twice per day in addition to over 10 webinars on using the Mirror Trader platform through DailyFX Plus. DailyFX Plus is freely available to all live FXCM account holders or for $19.99 per month.


