


Article Summary: Timing market entries is a critical skill for Forex traders to master. Today we will learn to time trending trades using the CCI Oscillator.
When traders think technical indicators, normally oscillators come to mind. Oscillators are a class of indicators designed to track price by moving (oscillating) either above or below a centerline. Knowing how to read and understand these indicators can help trader’s specifically pinpoint market entries. Today we will review one of these indicators from the oscillator family, the Commodity Channel Index (CCI), and discuss how we can use it to trade retracements with the trend.
Learn Forex –CCI Overbought / Oversold
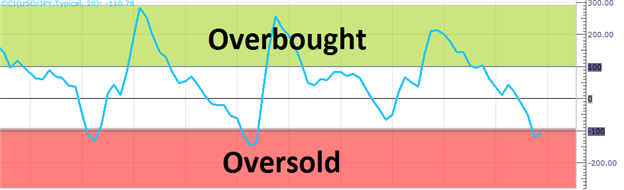
(Created using FXCM’s Marketscope 2.0 charts)
If you are already familiar with RSI, you are one step closer to trading with CCI. Both utilize a mathematical equation to depict overbought and oversold levels for traders. Pictured above, CCI uses a +100 value to indicator overbought levels, while below -100 value represents an oversold value. Normally 70-80% of the values tend to fall between overbought and oversold levels. As with other overbought/oversold indicators, this means that there is a large probability that the price will correct to more representative levels. Knowing this, trend traders will wait for the indicator to move outside of one of these points before reverting back in the direction of the primary trend. Let’s look at an example using the strong trend on the USDJPY.
Learn Forex –USDJPY Trend with CCI

(Created using FXCM’s Marketscope 2.0 charts)
Above we can see an example using a Daily graph of the USDJPY currency pair. The pair is in an established uptrend with price remaining above a 200 period moving average. Knowing this, trend traders should look to initiate new buy positions. The primary way of timing entries with CCI in an uptrend is to wait for the indicator to move below -100 (oversold), and enter into the trade when CCI moves back above -100. This creates an opportunity to sell the currency as momentum is returning back in the direction of the trend.
As CCI now reads below -100 on the USDJPY, traders can wait for an opportunity to trade with the resumption of the trend. It is always important to wait for momentum to return with CCI closing above -100. On a daily chart, this means waiting for a daily candle close in order to confirm CCI moving back above an oversold reading.
To contact Walker, email instructor@dailyfx.com. Follow me on Twitter at @WEnglandFX.
To be added to Walker’s e-mail distribution list, CLICK HERE and enter in your email information
Want to learn more about trading CCI? Sign up for our free CCI training course and learn new ways to trade with this versatile oscillator. Register HERE to start learning your next CCI strategy!


