


Article Summary: The GBPNZD has declined 753 pips from the December 26th high. To find if scalping opportunities remain present, traders turn to identifying short term momentum.
Before executing any new Forex positions, it is always important to determine if we are looking to buy or sell a currency pair.This decision can be made easier through an understanding of technical analysis on shorter term time charts. Today we will review the ongoing GBPNZD trend and see if there is an opportunity for scalping.
Looking at the 4Hour chart depicted below, the pair has currently declined as much as 753 pips through today’s trading. With the December 2012 high set in place at 1.9781 trend traders will look for the pair to continue to print lower lows and lower highs. This ultimately leads us to the question, “How strong is the GBPNZD’s short term momentum?” To get a closer look at where price is heading, we can zoom in even closer to a 30minute graph.
Learn Forex – GBPNZD 4Hour Trend
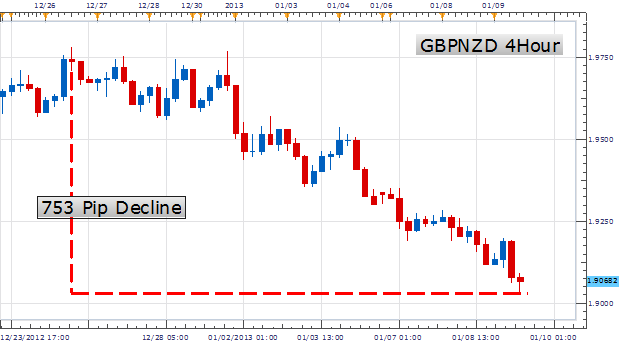
(Created using FXCM’s Marketscope 2.0 charts)
GBPNZD Building Blocks
Pictured below we can see our current downtrend in the GBPNZD divided into Building Blocks on a 30 minute graph. The analysis for Block 1 began last Wednesday, on January 2nd. The pair quickly carved out a lower high at 1.9574 before moving as much as 268 pips lower. Since a lower high and a lower low were created, Block 1 has been labeled in red to indicate its strong bearish bias. Once the direction of Block 1 is found, our analysis shifts to Block 2 to find out if momentum is continuing in the same direction.
Block 2 begins where Block one concluded and also depicts continued bearish momentum. Our analysis reveals that the standing Block 2 resides at 1.9357 well under the previous lower high. With both a lower high and lower lows being printed, Block 2 is indicative of strong continued downside momentum. Using this analysis, traders can begin looking for opportunities for fresh scalping opportunities by selling the GBPNZD.
Learn Forex – EURJPY Building Blocks

(Created using FXCM’s Marketscope 2.0 charts)
Remember, the purpose of blocking off your chart in the above fashion is designed to find continued market momentum. The strongest trends should consistently have both blocks painted in the same color as price moves in one continuous direction. Once a strong trend is found traders can then feel free to apply the scalping strategy of their choosing. This analysis would only be invalidated on the creation of a higher high, potentially marking a market reversal.
---Written by Walker England, Trading Instructor
To contact Walker, email WEngland@FXCM.com . Follow me on Twitter at @WEnglandFX.
To be added to Walker’s e-mail distribution list, send an email with the subject line “Distribution List” to WEngland@FXCM.com .
Been trading FX but wanting to learn more? Been trading other markets, but not sure where to start you forex analysis? Register and take this Trader Quiz where upon completion you will be provided with a curriculum of resources geared towards your learning experience.


