


In many instances on a short term basis, the Forex market will move against a primary trend. These instances can provide many opportunities to either sell rallies or buy market dips, when momentum swings back into the direction of the primary trend. Below we can see an example of the GBPUSD 4Hour chart trending lower over the past 6 weeks. Along the way there have been many opportunities to find selling opportunities as the market provides a short term rally. So how can we better identify these chances to trade?
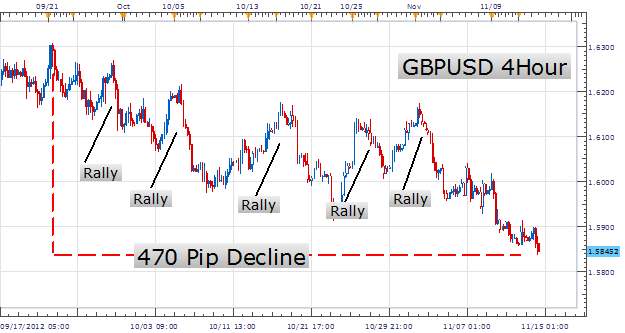
(Created using FXCM’s Marketscope 2.0 charts)
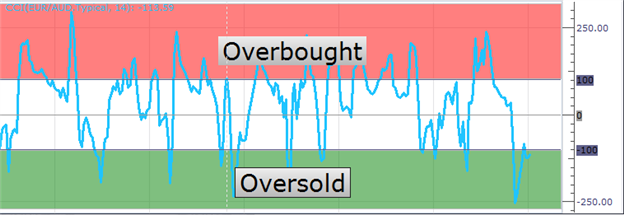
To time our entry into a trade, an oscillator can be used. When a market is in a downtrend, traders can wait for an indicator such as CCI to become overbought. Overbought describes a scenario where the market may be overvalued causing an indicator to reach its upper bounds. CCI is very similar to other oscillators, such as RSI, in that it depicts overbought and oversold levels for traders. Pictured below, we can see that above the +100 value is considered overbought while below the -100 value is considered oversold.The key is to time our entry when momentum returns to the downside. This means waiting from the indicator to turn back below +100 and begin moving lower. Let’s view some previous examples using our established GBPUSD downtrend.
Below we again can see our GBPUSD 4HR chart previously mentioned, but this time we have included the CCI indicator. You will notice that there have been a total of four opportunities to sell the pair as momentum returned lower. The key is to time your entry as CCI moves back below +100 indicating the conclusion of our short term rally with momentum returning to the markets longer standing trend. As with any strategy, trading market swings requires limiting our risk in case our trend ends. One way to manage risk is to place a stoporder over the previous swing high. This way in the event that our downtrend is concluded we can exit any positions to sell at their first convenience.
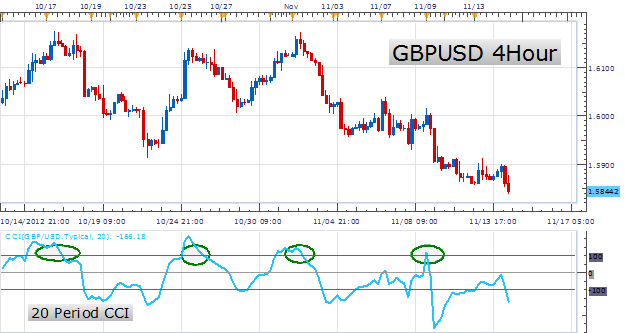
(Created using FXCM’s Marketscope 2.0 charts)
---Written by Walker England, Trading Instructor
To contact Walker, email instructor@dailyfx.com. Follow me on Twitter at @WEnglandFX.
To be added to Walker’s e-mail distribution list, send an email with the subject line “Distribution List” to instructor@dailyfx.com.
Want to learn more about trading CCI? Take our free CCI training course and learn new ways to trade with this versatile oscillator. Register HERE to start learning your next CCI strategy!


