


Finding and understanding trendlines can be extremely useful to both trend and breakout based traders. As discussed in a previous edition of Trend Of The Day, traders can always look to sell into a downtrend as a currency pair approaches a descending trendline acting as resistance. But what happens in the event of a pair reversing with price breaking through an established trendline? Today we will we will examine what to do in these instances through identifying breakout trading opportunities.
(Created using FXCM’s Marketscope 2.0 charts)
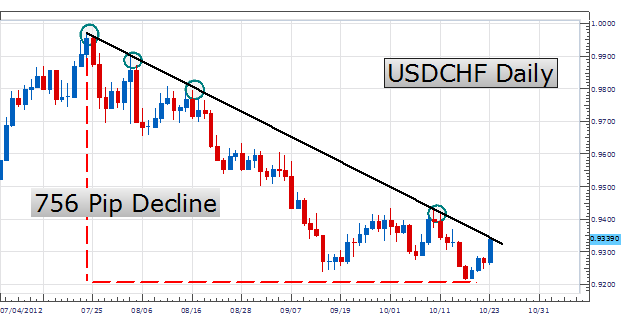
The USDCHF daily chart seen above represents a good example of a declining currency pair. From July 24th, the pair has declined as much as 756 pips. Along its descent, the USDCHF has developed a strong trendline that has been formed by connecting the July 24th, September 16th and October 10th highs. This line has acted as a form of resistance holding the pair from breaking higher and potentially reversing its current direction.
Breakout traders have been waiting patiently for their opportunity to enter the market upon the conclusion of the established trend. A breakout entry by design is a technical strategy developed to trade as price breaks through an established support and resistance level. In a downtrend Entry orders can be placed above resistance waiting for a new high to be made. Pictured below we can see this plan put into action with a potential entry to buy the USDCHF on a break above resistance at .9380. To complete the trade idea, traders can also limit their risk using a stop under the previous line of resistance. In the event of a false breakout, traders will wish to exit their positions on a return to lower lows.

Created using FXCM’s Marketscope 2.0 charts)
My preference is to set entries to buy the USDCHF on a trendline break above .9380. Stops should be set under new support near .9330. First targets can look for 100 pips profit at .9430 for a 1:2 Risk/Reward ratio.
Alternatives include the USDCHF trendline holding with price breaking to lower lows.
---Written by Walker England, Trading Instructor
To contact Walker, email instructor@dailyfx.com. Follow me on Twitter at @WEnglandFX.
To be added to Walker’s e-mail distribution list, send an email with the subject line “Distribution List” to instructor@dailyfx.com.
New to the FX market? Save hours in figuring out what FOREX trading is all about.
Take this free 20 minute “New to FX” course presented by DailyFX Education. In the course, you will learn about the basics of a FOREX transaction, what leverage is, and how to determine an appropriate amount of leverage for your trading.
Register HERE to start your FOREX learning now!


