


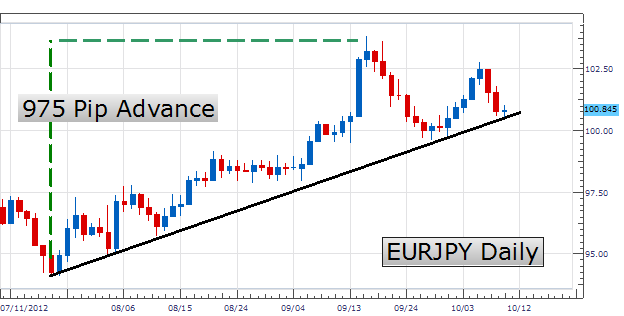
Trading trends is an excellent method of execution for traders looking to take advantage of the long term momentum of a specific currency pair. Currently, one of the strongest trends developing in the Forex market has been the EURJPY. The pair has rallied as much as 975 pips over the twelve weeks from its July 2012 low at 94.10. At present the pair can be seen consolidating and has moved back to the established trend line pictured below. As price reaches this long term point of support near current price levels traders can look to institute new buying positions with the trend. Let’s take a look at potential levels to enter the market by getting a closer look at current price.
(Created using FXCM’s Marketscope 2.0 charts)
Bellow we can get a close look at current EURJPY price levels using a 4hr chart. Currently, price is supported by the long term trendline mentioned earlier by connecting the pair’s lows. However, despite the lows of the EURJPY increasing in value, it has yet to form a higher high since September 17th. The pair could potentially be creating a triangle pattern if we form a line of converging resistance by connecting the standing September and October highs. With these price levels in mind and a triangle pattern identified, we can then move forward with a trading plan for the EURJPY.
Primarily, there are two methods of trading a triangle pattern, as we mentioned in the previous chart of the day article Trading Triangles for Consolidating Markets. When there is a strong existing uptrend as seen in the EURJPY, traders can look to buy levels of support inside the interior of the triangle. Traders may look to simply trade using market orders or even utilize an oscillator such as RSI to plan their point of entry. Regardless of the method chosen, once a trade is placed, stops should be positioned under current support levels with limits added near standing resistance.

(Created using FXCM’s Marketscope 2.0 charts)
My preference is to buy the EURJPY currency pair as close to our current trendline as possible. Stops can be placed under support at 100.30. Buy orders can look to take profit at our descending line of resistance near 102.00 or better for a clear 1:2 Risk/Reward level.
Alternative scenarios include price breaking under support to create lower lows.
---Written by Walker England, Trading Instructor
To contact Walker, email WEngland@FXCM.com . Follow me on Twitter at @WEnglandFX.
To be added to Walker’s e-mail distribution list, send an email with the subject line “Distribution List” to WEngland@FXCM.com .
Want to learn more about trading RSI? Take our free RSI training course and learn new ways to trade with this versatile oscillator. Register HERE to start learning your next RSI strategy


