


The markets cheered and the EURUSD rallied when a plan was produced to plow through the Euro-zone sovereign debt crisis. However, the EURUSD is still entrenched in a longer term down trend and this recent rally simply pushed the pair into solid technical resistance. Look for high probability areas on a price chart to identify selling opportunities.
On the daily price chart below, notice how the prices created a series of lower highs and lower lows. This is a simple method for determining the direction of trend.
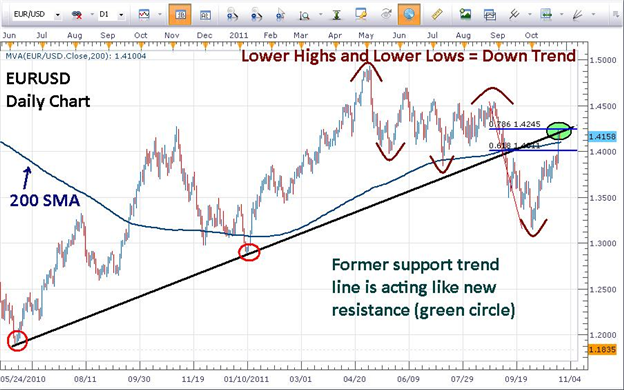
Two points of resistance collided with price yesterday near 1.4245.
- The former support line turned new resistance connecting the June 2010 and January 2011 lows (black line above).
- The 78.6% retracement level from the August 29, 2011 high to the October 4, 2011 low
This gives us a good chance at a good risk to reward ratio as the 1.4245 area is significant resistance in the eyes of the market participants. This confluence of resistance offers us an opportunity to align our trade in the direction of the daily trend so we will consider sell trades.

Today, we are using the MACD oscillator to help us time entries into the pair. On the EURUSD 4 hour price chart, the MACD indicator is getting ready to cross down which is in the direction of the daily trend. Therefore, our MACD signal is aligning itself up with the direction of the trend creating a good chance at a good risk to reward ratio trade.
Once the Red MACD line crosses the blue signal line, we have our signal to enter the trade. Place the stop just above the swing high from yesterday near 1.4270. Look to take profits near 1.3700 for a nearly a 1:4 risk to reward ratio.
Additional Resources
MACD: Triggering Trades in Oscillating Markets
Fibonacci Retracements: How to Trade Fibs in Forex
---Written by Jeremy Wagner, Lead Trading Instructor, DailyFX Education
To contact Jeremy, email jwagner@dailyfx.com. Follow me on Twitter at @JWagnerFXTrader.
To be added to Jeremy’s e-mail distribution list, send an email with the subject line “Distribution List” to jwagner@dailyfx.com.


