


You may have heard the cliché of “buy low and sell high”. Breakout trend traders know that when prices reach levels never seen before, then there is unusual strength in the trend. Therefore, the breakout trend traders axiom is “buy high and sell higher”.
The NZDUSD has been in a strong trend to the upside and recently reached all time highs. Interest rate differentials between the NZD and USD economies have been wide for some time. Large interest rate differentials tend to lead to strong trends in a risk taking environment. A strong stock market for the past 2 years is evidence of the risk appetite of investors as they seek higher yields. ( “ The Carry Trade” )
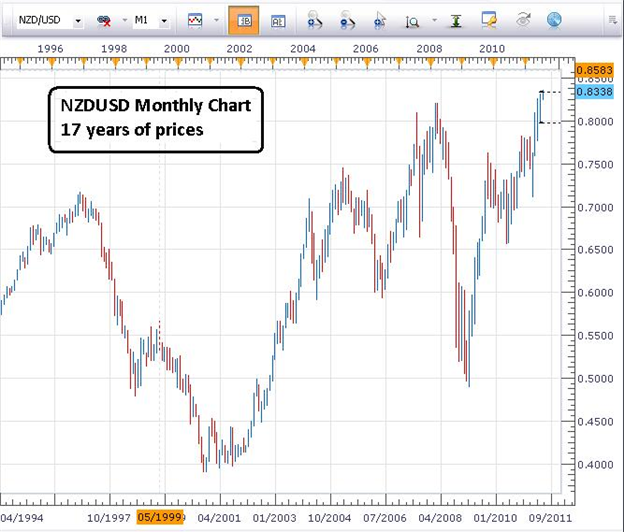
(Created using FXCM’s Marketscope 2.0 charts)
Additionally, our in house proprietary indicator (SSI) is suggesting that higher prices are in store. There are nearly 6 times as many short traders as long traders. 85% of the traders are trying to pick a top against a strong up trend in the NZDUSD. SSI can be a powerful contrarian signal when the SSI traders are trading against the trend.
The Trade
Since the NZDUSD has been in a strong trend, a trending, breakout, or momentum type of strategy is our better choice. ( “ Trading Breakouts” ) When trading with SSI signals, I prefer to use a breakout type of strategy. The reason is because with a little bit of practice, breakout trades can be identified using only a basic understanding of support or resistance.

(Created using FXCM’s Marketscope 2.0 charts)
Trading Plan to Follow:
- In an uptrend, identify resistance on a chart time frame of 1 hr or larger. For this example I will use the 4 hr chart. ( “How to Trade with Support and Resistance” )
- Place an entry order to go long 1 pip above the identified resistance level. Resistance is at .8334 so the entry order is placed at .8335
- Place a stop loss about 10-15 pips below the next level of support. Support is at .8232so the stop loss is placed at .8220.
- Risk no more than 5% of your account balance on ALL open trades.
In this case, since the NZDUSD is trading at all time highs, I will manually trail my stop since I don’t want to limit any profit potential. After all, if the trend is strong enough to push to all time highs, then maybe the trend can push my trade for a while. If the exchange rate prints a series of higher lows, manually trail the stop so it is placed10-15 pips below the next swing low.
For more daily updates on FXCM’s Proprietary indicator SSI and how to use it, log into DailyFX Plus with your live FXCM account username and password.
Jeremy Wagner contributes to the Instructor Trading Tips articles.
http://www.dailyfx.com/how_to_trade_forex/course_trading_tips
To receive more timely notifications on his reports, email instructor@dailyfx.com to be added to his distribution list.


