


Whether a bailout plan for Greece can make its way into being is of little consequence, according to EURUSD and US Stock markets. Both markets reflect the appetite of traders taking on risk. Right now, both markets are suggesting they have feasted on risk long enough and look to shed some price as risk appetite wanes.
The EURUSD dropped 1.78% on Wednesday which is a sizeable move for currencies. The SPX500 (which tracks the S&P500) lost about 1.8% as well. Prices are near support right now. If the support zone breaks and if prices move lower, the selling pressure could intensify for both the EURUSD and the SPX500.
The EURUSD Trade
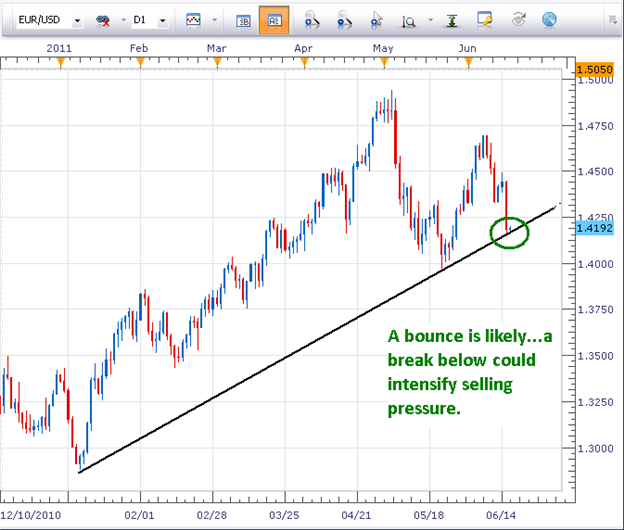
(Created using FXCM’s Marketscope 2.0 charts)
The black upward sloping trend line has contained prices since January 2011. Prices are resting right on top of this trend line as we speak. A break below the black line could intensify the selling pressure and that is the trade we want to participate in.
Sell short on a break below the trend line.
Place a sell order at 1.4150.
Place a stop just above the swing high that is forming right now (near 1.4220)
Since the break could be powerful, we will manually trail this stop loss based on subsequently lower swing highs.
The SPX500 Trade
The SPX500 has a similar chart compared to the EURUSD.

(Created using FXCM’s Marketscope 2.0 charts)
A break below the orange trend line support would be a significant break of support. The orange line has held prices up since the panic low of March 2009!
Additionally, there is horizontal support from the March 2011 low at 1246.0.
If prices break below 1246, look for risk aversion to snowball and worldwide stocks to sell off. A resident outside of the United States can trade the share indices through FXCM’s CFD that tracks the stock markets.
Sell short SPX500 at 1245.0
Place a stop at 1305.0
Manually trail the stop.
Jeremy Wagner contributes to the Instructor Trading Tips articles.
http://www.dailyfx.com/how_to_trade_forex/course_trading_tips
To receive more timely notifications on his reports, email instructor@dailyfx.com to be added to his distribution list.


