


Talking Points:
- This is an educational article as part of a three-part series to investigate the most common and applicable mechanisms for finding support and resistance in the Forex market. This is part One, and here we’ll look at one of the more simple systems of support and resistance analysis with psychological whole numbers.
- If you’re looking for basic Forex education, please check out our New to FX Guide, which is available completely free-of-charge.
In our previous educational piece, we discussed the prospect of using price action to trade support and resistance. As we shared, support and resistance is a key area of technical analysis, and not because it shows or tells us what exactly will happen with future prices. The importance around support and resistance is in the risk management aspect of trading, as it gives traders a spot with which they can look to place stops so that, if the trade doesn’t work out, the loss can be mitigated.
While this might not be the most fun or entertaining topic to discuss, it’s vitally important to the trader. As we looked at in a prior piece, risk management is a brutal necessity for Forex traders. And the reason for that is the fact that no analytical method is or ever will be perfect: As long as the trader can see the gains from three, five or ten winning setups get erased by one ‘really bad trade’, the prospect of consistent profitability will likely be a distant hope. The future is uncertain, and this will likely remain as such for the foreseeable future.
This is where stops come into play, to mitigate the damage when setups don’t work out the way that we want them to. Traders, especially newer ones, will often struggle with where to set stops as they don’t want to get taken out of the trade. It’s only with time that the unpredictable nature of short-term markets will motivate one to look at the bigger picture, rather than trying to win each and every trade as if it’s a battle that cannot be lost.
Support and resistance is key for setting stops. For the trader that wants to buy, they likely don’t want to sit in the trade as prices are driving down to fresh lows. And on the other side, the trader looking to sell probably doesn’t want to sit in a short position while prices are ripping in their face. Support and resistance can help to eliminate those scenarios, as traders looking to buy can wait for support to show, place a stop on the other side so that they remain in the trade as long as support remains respected.
In this article series, we’re looking at three of the more common ways of finding support and resistance in Forex pairs. This is by no means an exhaustive list, as there are a plethora of ways of identifying support and resistance. But this is where price action can help, as the trader doesn’t necessarily need to know the reason why support or resistance is there; the simple fact that it shows can be workable enough to build into a strategy or an approach.
Psychological Levels
We’re going to start off with one of the more simple support and resistance mechanisms, and that’s ‘psychological levels’. Psychological levels, often also referred to as ‘whole number support and resistance’ are simply rounded prices that may elicit a behavioral change within a market. Think the level of parity on EUR/USD. If EUR/USD was trading below parity, even if by only a single pip, that price would seem significantly cheaper than if it were trading above by a single pip. Most human beings will perceive a price of 1.0001 as significantly more expensive than the 2 pips away from .9999. This isn’t necessarily an automatic reaction, where prices above parity will be promptly sold simply because prices are above 1.0000, but this is the type of relationship that will have a tendency to play out with future price action. As drivers continue to show on both sides of the Euro, the bar will be higher for a continued bullish movement, as this psychological resistance can act as a hindrance to price’s further movement. This is the same reason many retail outlets will employ prices that end in .99; it allows them to capture as much profit as possible without the product ‘seeming’ or ‘appearing’ more expensive.
This relationship plays out at a variety of levels across markets over a variety of time frames; but if you’re seeing prices find support or resistance at a rounded-level, this is likely at least a contributing reason as to why. This is very similar to what’s taking place in USD/JPY at the moment. When prices were running-lower, support showed around the level of 110.00, albeit briefly before sellers were able to drive-below. After finally finding support around the 109.00-handle, prices bounced back and thru that 110.00 level. But as we neared 111.00, bullish momentum began to wane shy of prior resistance that had previously printed at 111.00.
On the below chart, we’re outlining how this reversal played out. When USD/JPY was on the way-down, support showed briefly around 111.00 (shown in orange), which then became resistance after prices moved-down to deeper support at that 110.00 handle (in blue). That support was unable to hold the tide of sellers, and soon became resistance as the bearish move continued-lower (shown in red). But after prices moved-down to 109.00, buyers began to show up again, giving us a sequence of wicks off the lows highlighting that support (shown in purple). This led into a bullish move that saw prices re-drive towards that prior resistance zone around 111.00, which has given pause to the bullish move as bulls shy away from prior resistance.
USD/JPY Four-Hour: Support to Resistance at 111.00, 110.00, Reversal Back to 111.00
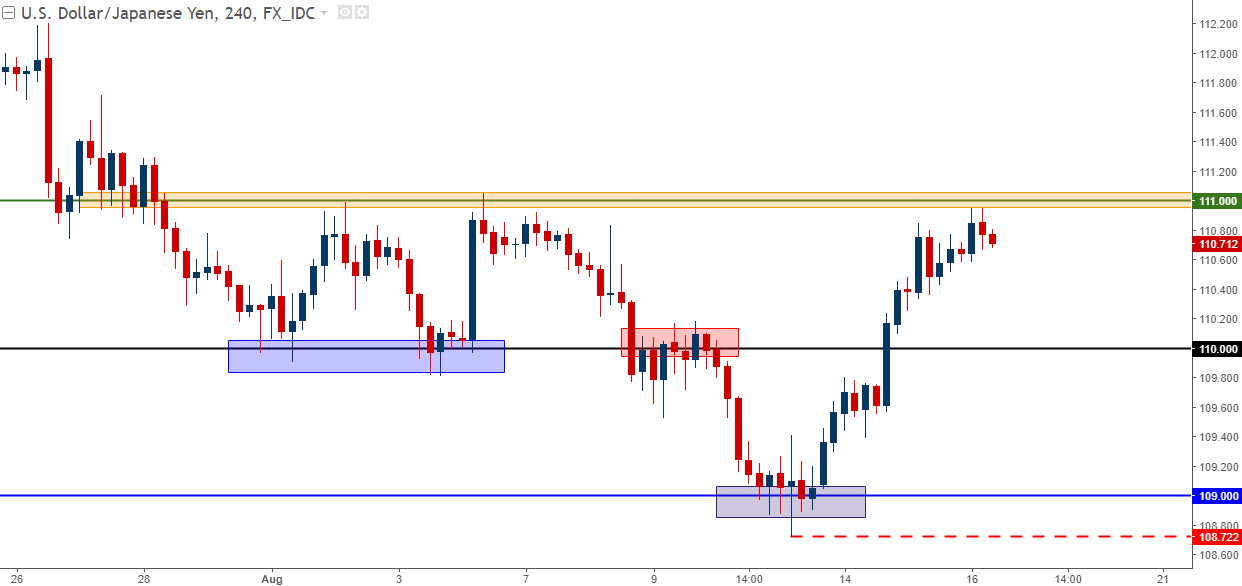
Chart prepared by James Stanley
This type of relationship can also play out in trending markets. As prices run to fresh highs or lows, traders and market participants are often looking for workable levels as prices traverse new territory on the chart. Using a recent example in EUR/USD, we can see where prices had a tendency to slow down or soften each time a new big figure came into play. On the chart below, we have lines drawn at even 100-pip increments at each ‘whole number level’ between 1.1000 and 1.1900, and we can see where price action had a tendency to display some element of support or resistance around these areas as prices were launching-higher.
EUR/USD Hourly: Levels Applied Within 100-pip Increments
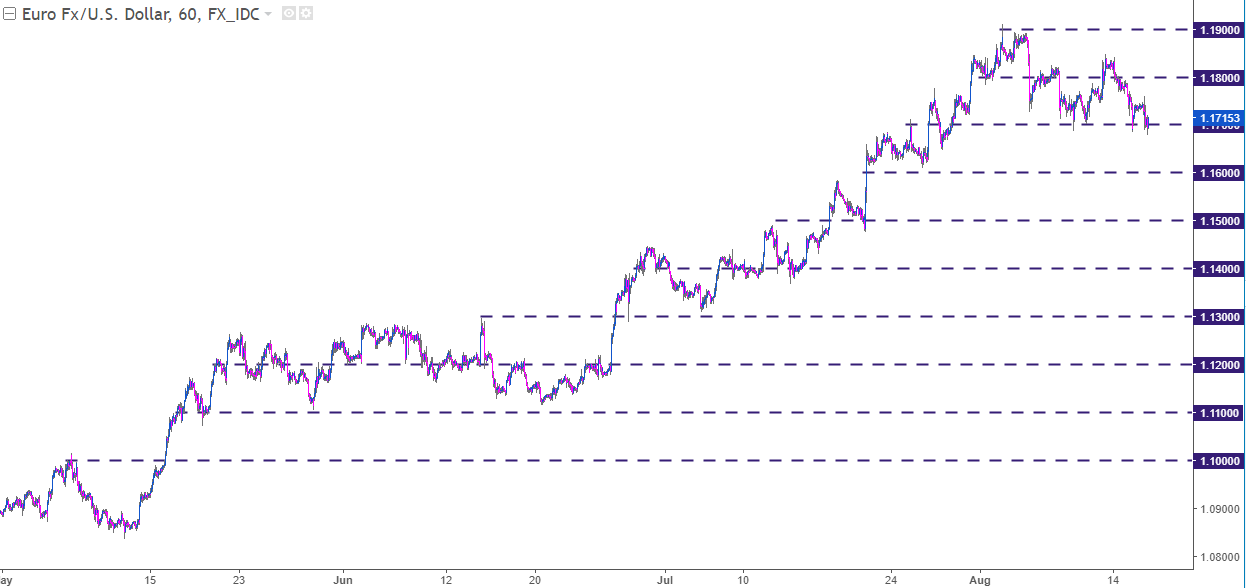
Chart prepared by James Stanley
Are All Whole Numbers Equally Important?
The ‘more rounded’ the level, the more likely it is to elicit support or resistance. But as is normally the case in markets, exceptions are aplenty. In many cases, the level of 1.1000 will be more interesting as a potential support or resistance area than a price of 1.1100 or 1.0900. This can change, and each situation is unique, but if there is ‘confluence’ between a psychological level and another form of support or resistance, whether that comes from a Fibonacci retracement or a pivot point or any other mechanism of identifying levels, then the less-rounded level may elicit more interest from market participants.
Let’s go back to that example in USD/JPY to illustrate. USD/JPY is currently seeing resistance around the 111.00 level after having run through the 110.00 level, which would be ‘more rounded’ than 111.00. But – if we draw a Fibonacci retracement around the most recent bearish move, we’ll see that the 38.2% retracement of that level comes-in right at 110.93, which is just a few pips shy of that 111.00 price. This is another reason for sellers to come in at resistance, and this could strengthen the potential behind 111.00 as this additional mechanism to draw-in sellers creates additional pressure on the bid. The fact that the Fibonacci level is so close to the 111.00 psychological level would make this a confluent ‘zone’ of potential resistance that runs from 110.92-111.00.
Confluence of Support/Resistance Can Increase the Interest Around a Whole Number
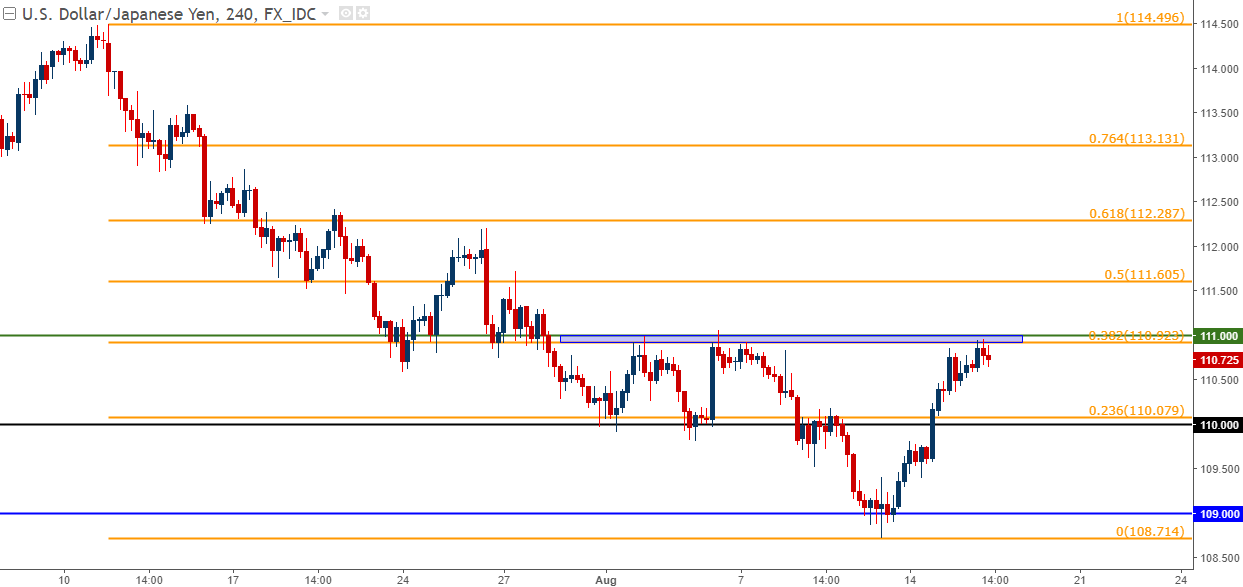
Chart prepared by James Stanley
Outside of confluence, prices that are ‘more rounded’ will have a tendency to produce additional interest across markets as these psychological prices are more noticeable. With a pair like EUR/USD, we can see this in the even 1,000-pip increments above and below the level of parity (1.0000). These can be considered as ‘major psychological levels’, and are relevant for swing or longer-term traders.
EUR/USD Weekly Since 2002 with ‘Major Psychological Levels’ Applied

Chart prepared by James Stanley
In the above chart, we can see numerous instances of support or resistance showing around each of these psychological levels. While no level is perfect, prices had a tendency to slow during trends as these levels were encountered, and in some cases a direct reversal showed-up, such as we saw in 2008 with the top around 1.6000 or again in 2009 with the top at 1.5000 or in 2014 with the top at 1.4000.
We can take this a step further by looking between each of these major psychological levels, investigating the mid-point between each, showing in 500-pip increments. These can be considered ‘less major’ psychological levels, but are still vitally important to price action. On the chart below, we’ve added these levels to the same EUR/USD chart we had looked at previously.
EUR/USD Weekly Since 2002, ‘Less Major Psychological Levels’ Added

Chart prepared by James Stanley
Now that we have the bigger-picture, longer-term major and less-major psychological levels applied, we can begin to look at near-term strategy. Levels within 100-pip increments, such as we had discussed at the beginning of this article, can be considered ‘minor psychological levels’. So, 1.0900 and 1.1100 would be considered ‘minor’ levels while 1.1000 would be a major level. On the chart below, we’ve incorporated these minor levels to the same EUR/USD chart that we’ve been building.
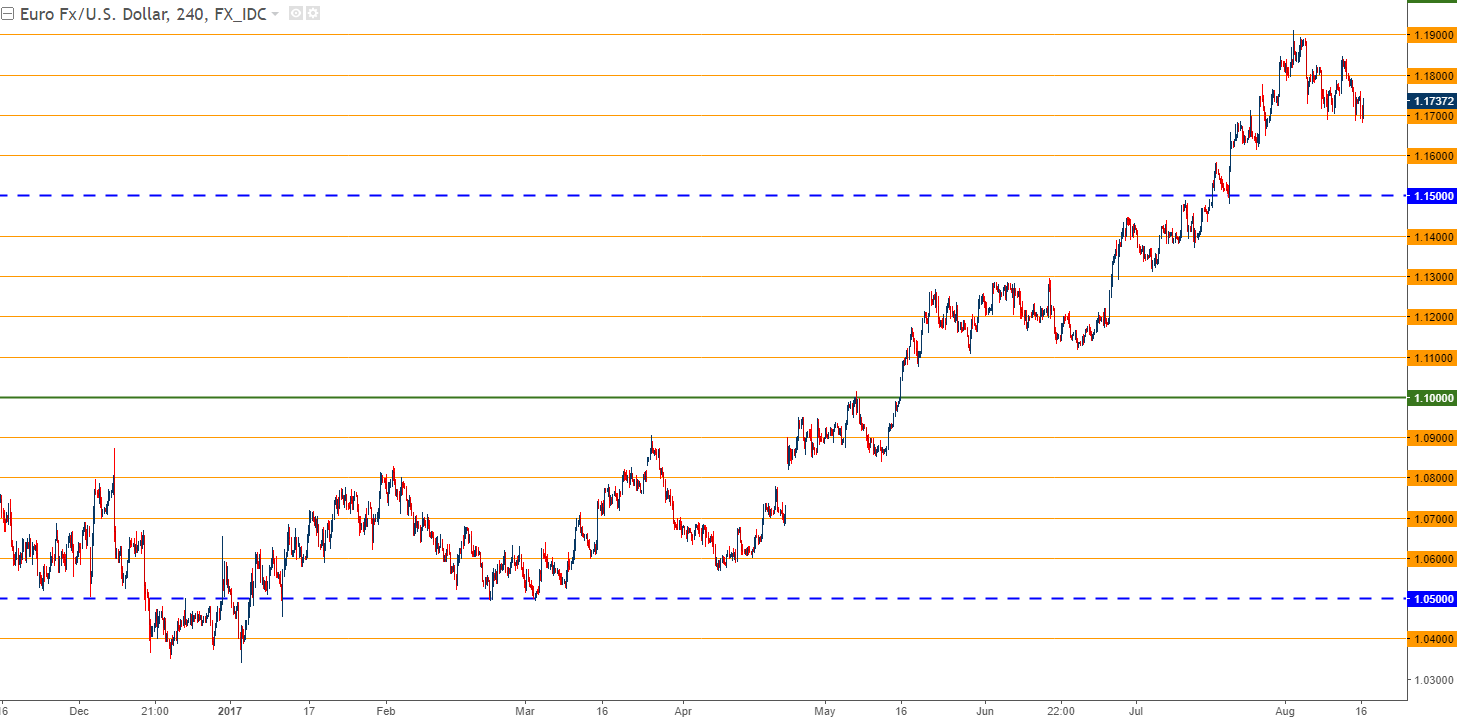
Chart prepared by James Stanley
Notice, again, that while not every level is perfect, catching resistance and then becoming support as this up-trend developed; many cases of ‘higher-low’ support showed-up at or around a psychological level. And when prices were bursting higher, resistance had a tendency to show as a new psychological level came into play.
Traders looking to buy the up-trend in EUR/USD can wait for support to show, as indicated by wicks at the support level of interest (as we discussed in our last article); and then they can look to take profits as a new level of resistance comes into play as the trend continues higher. On the daily chart of EUR/USD below, we’re highlighting some of the areas where this took place, using blue boxes to show support at or around a psychological level in the up-trend; and a red box to denote a potential profit target after resistance began to show.
Notice how the major and less-major levels at 1.0500, 1.1000 and 1.1500 each offered an interesting point of reference for Euro bulls, with 1.0500 and 1.1500 offering 'higher-low' support while 1.1000 and 1.1500 each offered a bit of resistance on the way-up for profit targets.
EUR/USD Daily with Major, Less-Major and Minor Levels (Support in Blue, Resistance in Red)
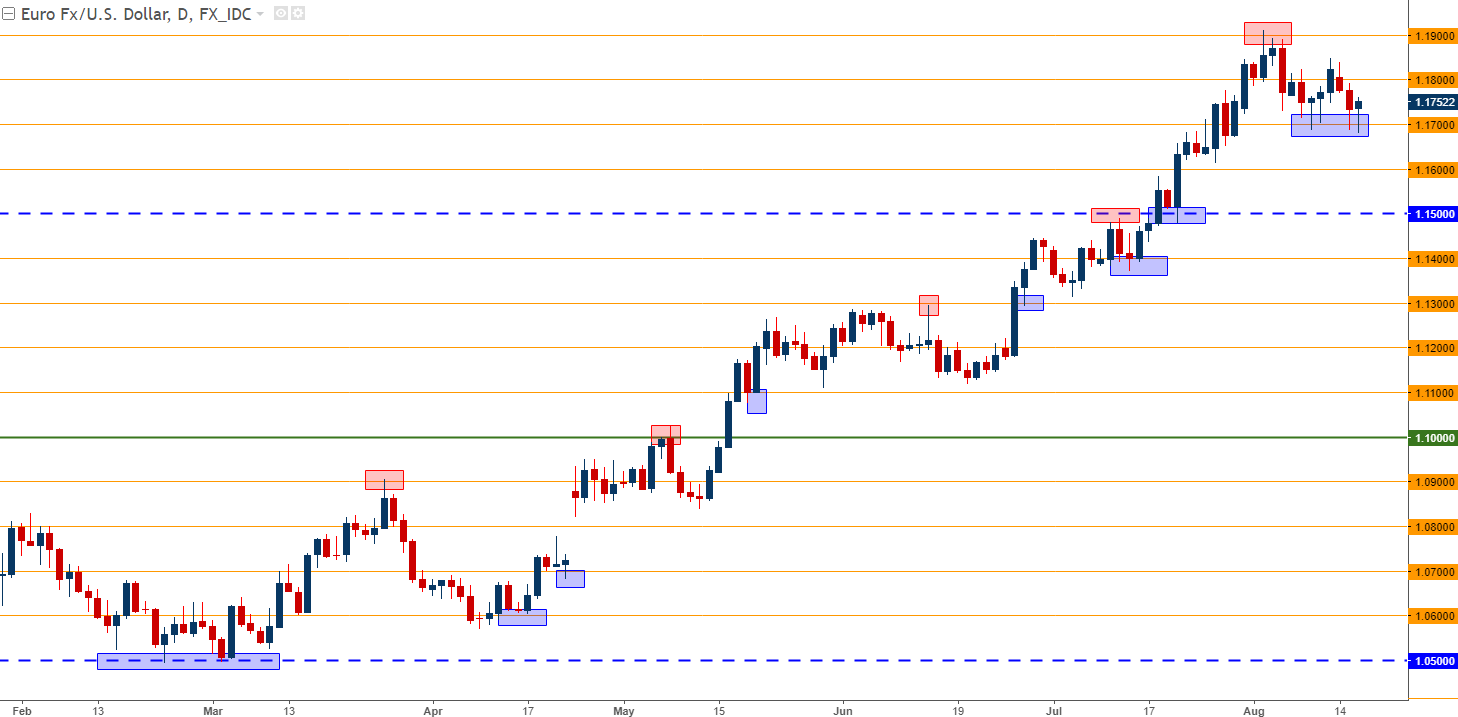
Chart prepared by James Stanley
Remember – psychological levels are but one way of finding support and resistance levels in the Forex market. What we just discussed above can be made even more powerful by confluence between multiple support and resistance indications, and in our next two articles, we’re going to look at two more of the common applications in the Forex market.
If you’d like to be notified as those articles become available, you’re welcome to join my distribution list from the link below and I’d be happy to let you know once it’s available.
--- Written by James Stanley, Strategist for DailyFX.com
Contact and follow James on Twitter: @JStanleyFX


