


Talking Points:
- USD/CAD Prices Decline as GDP Figures Meet Expectations
- Next Support for the USD/CAD is Found at 1.3352
- Looking for additional trade ideas for US Dollar based currency pairs? Read our Dollar Forecast
Crude Oil prices have declined to test a daily value of support near today’s low of $46.26. This price decline has been predicated on some OPEC members hinting that they may be unwilling to cut production going into a meeting in Vienna later this month. This news has left many Oil traders sidelined, as prices may be prepared to bounce higher or breakout lower at current levels.
Below, we can see Crude Oil currently supported by an ascending trendline. This line has been formed by connecting a series of higher lows beginning with the August 3rd low at $39.17. A breakout below this value would be significant, and would suggest that Crude Oil’s 2016 uptrend may be in jeopardy. Alternatively if Crude Oil Prices remain supported at present levels, it may suggest a future bounce in prices back towards 2016 highs of $51.90.
Crude Oil Prices.
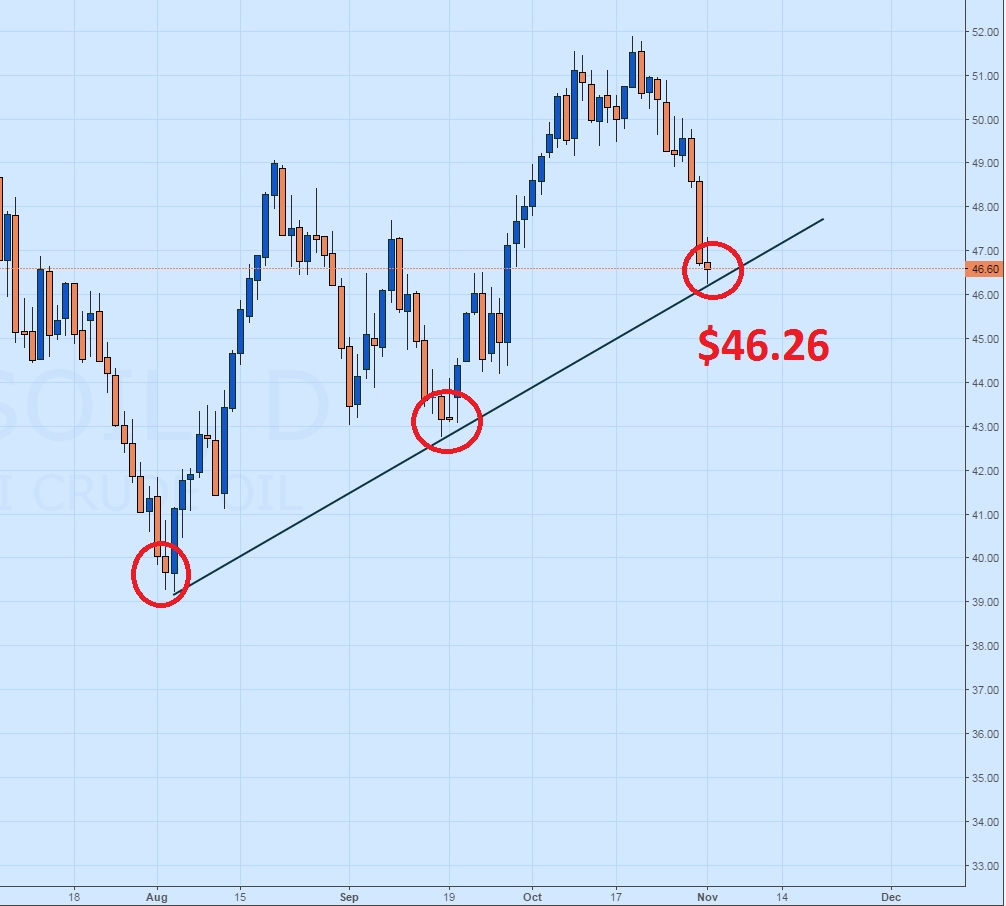
(Created Using TradingView Charts)
In the short run, Crude Oil prices can be seen bouncing off of the current daily lows in the 10 minute chart below. Despite this bounce, the Grid Sight Index (GSI) has interpreted the commodities move as a short term downtrend. Now, after reviewing 3,992,204 pricing points, GSI has indicated that prices have historically continued to decline by $0.22 or more in 56%. The first current bearish price distribution is found at $46.23. Traders should continue to monitor this value, as a move through this point may signify a fresh breakout in Crude Oil prices.
Alternatively, GSI has indicated that prices have risen by $0.48 or more in 56% percent of the 37 identified historical events. A bounce in price to $46.93 could be seen as the beginning of a retracement or a reversal of this morning’s decline. Traders looking for further confirmation of a bullish reversal, may elect to wait for Crude Oil prices to move through the final historical bullish distribution found at a price of $47.53.

--- Written by Walker, Analyst for DailyFX.com
To Receive Walkers’ analysis directly via email, please SIGN UP HERE
See Walker’s most recent articles at his Bio Page.
Contact and Follow Walker on Twitter @WEnglandFX.


