


Searching For Concise Recommendations That Can Improve Your Trading Skills? Then Our Traits Of Successful Traders Guide Is An Excellent Material For You! Obtain Them HERE
Talking Points:
- After Brexit, CHF/JPY failed to pose a new low
- CHF/JPY getting closer to resistance inside channel line
- Price action confined over the last three months between Fibonacci retracements
Introduction:
Over the last three months, CHF/JPY has failed to achieve any significant movement. The cross has accounted for an average rate of change of 0.19%. In comparison with the monthly trading activity of the two years before these three stagnated months, CHF/JPY registered an average monthly rate of change of 2.27%.
This trading environment could be taken as a signal that we are trading in a zone in which traders are indecisive for where CHF/JPY is heading.
Let’s move on to the charts so that we can get a better technical picture of CHF/JPY.
Long-Term Technical Outlook:
As we can observe in the chart portrayed below, since June of 2015 CHF/JPY started trading in a strong downward trend. During this period, trading action has mainly taken place within the boundaries of the symmetrical downward price channel with the exception of the aftermath of the Brexit referendum.
After the U.K.’s referendum to leave the European Union, CHF/JPY registered its lowest level, a level from which the CHF/JPY has failed to register a lower low; bringing now into consideration a bullish tone for the cross.
As of Wednesday’s New York session, the cross is hovering above the support trend line drawn from the 2016 low. Therefore, a further advance should be expected for the cross targeting the inside trend line of above-mentioned symmetrical channel. As a possible second target, the channel resistance line should be considered.
To invalidate this channel and set CHF/JPY for a stronger bullish bias, a higher high should be registered overturning the series of lower highs depicted with horizontal lines on the chart.
Now, let’s move to a bigger picture to know where the bigger trend favors CHF/JPY.
CHF/JPY D1 Chart:
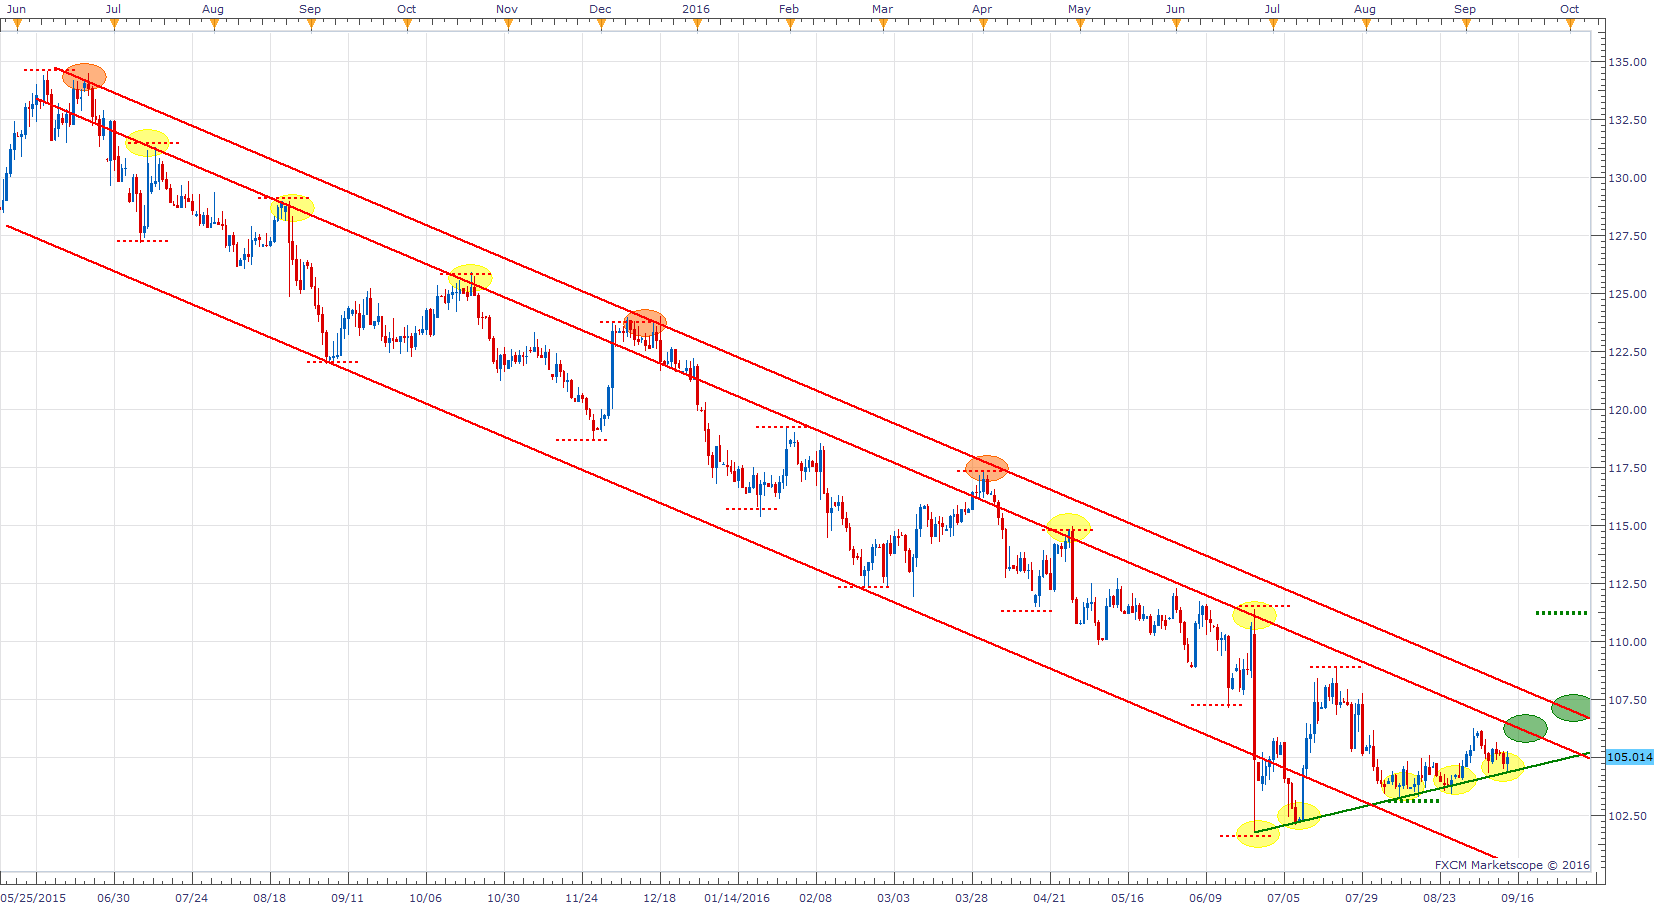
Chart prepared by Quasar Elizundia
Bigger Picture:
CHF/JPY M1 Chart:
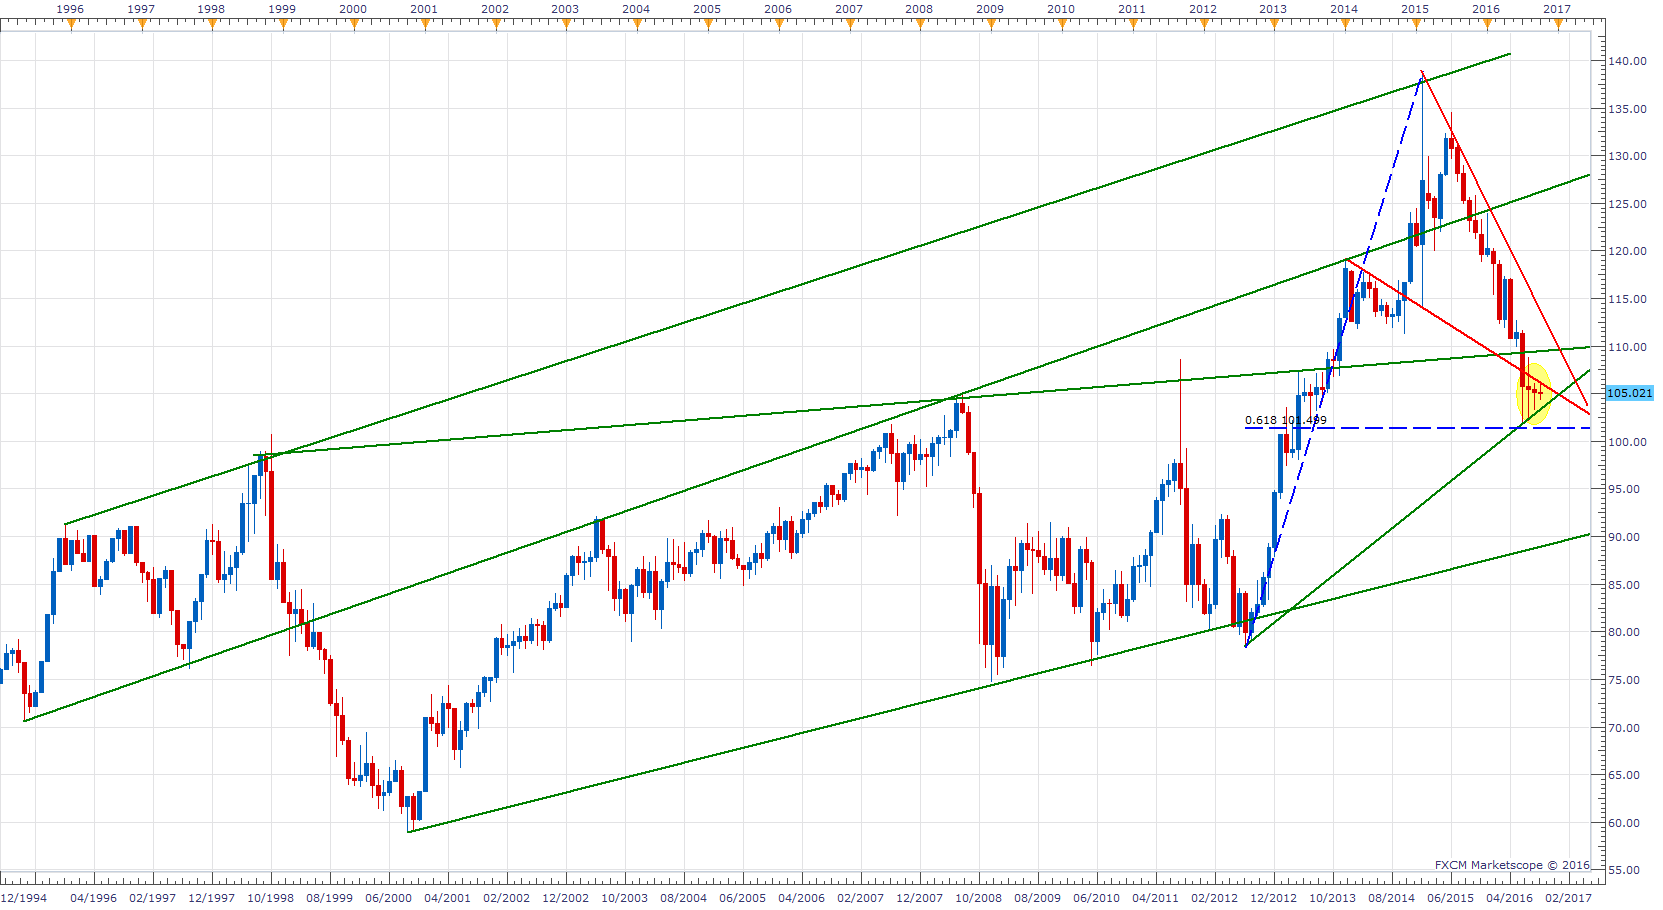
Chart prepared by Quasar Elizundia
As we can observe from our monthly chart above, the last three trading months have taken the form of Dojis. The Doji is a candlestick pattern known for showing market uncertainty or market indecisiveness of traders on which direction the market should heading.
It is no wonder that these candlesticks formed at this level as we can observe, this price zone is surrounded by key important technical levels.
First, we have the 61.8% and the 50% Fibonacci retracements from the 2012 low and the 2015 high. On the other hand, we have the support trend line drawn from the Low of 2012 and the resistance line drawn from the 2013 high.
In other words, CHF/JPY has been cornered by the above-mentioned technical levels. Usually, when markets are stuck in a price zone and finally a breakout takes place, this movement tends to be remarkably strong.
Given that the downtrend comes as a retracement of a bigger upside movement, my expectations are that this break takes place to the upside.
Bottom Line:
Given that on our daily chart CHF/JPY failed to continue the series of lower lows and our monthly chart shows that CHF/JPY stopped nicely on the 61.8% Fibonacci retracement in which has been an overall positive trend for the cross, the bias for the cross is bullish.
Nonetheless, in case that the cross starts registering lower lows and success to break below the 61.8 Fibonacci retracement, traders should address this currency cross with a bearish perspective.
Are you interested in knowing the Top Trading Opportunities of 2016? Click HERE
Are you a scalper? Then GSI is a tool that could help you on your short-term trades! Check it out HERE
Written by Quasar Elizundia


