


Talking Points
- GBP/USD Breaks Lower on CPI Data
- Bullish GBP/USD Reversals May Begin Over 1.3202.
- What’s next for the GBP/USD and US Dollar Pairs? Learn more with our Trading Guide
The GBP/USD continues to decline this morning, after U.K CPI figures were released worse than expected. Expectations were set for today’s CPI reading at 1.4%, however they were missed with a reported reading of1.3% (YoY) (AUG). This has caused the GBP/USD and trade to new weekly lows at 1.3166. Traders monitoring today’s break lower in the Cable now must turn to short term price trends to see if may continue to trade lower, or potentially bounce off of the standing daily lows.
GBP/USD, 30 Minute Chart & Channel

(Created using Marketscope 2.0 Charts)
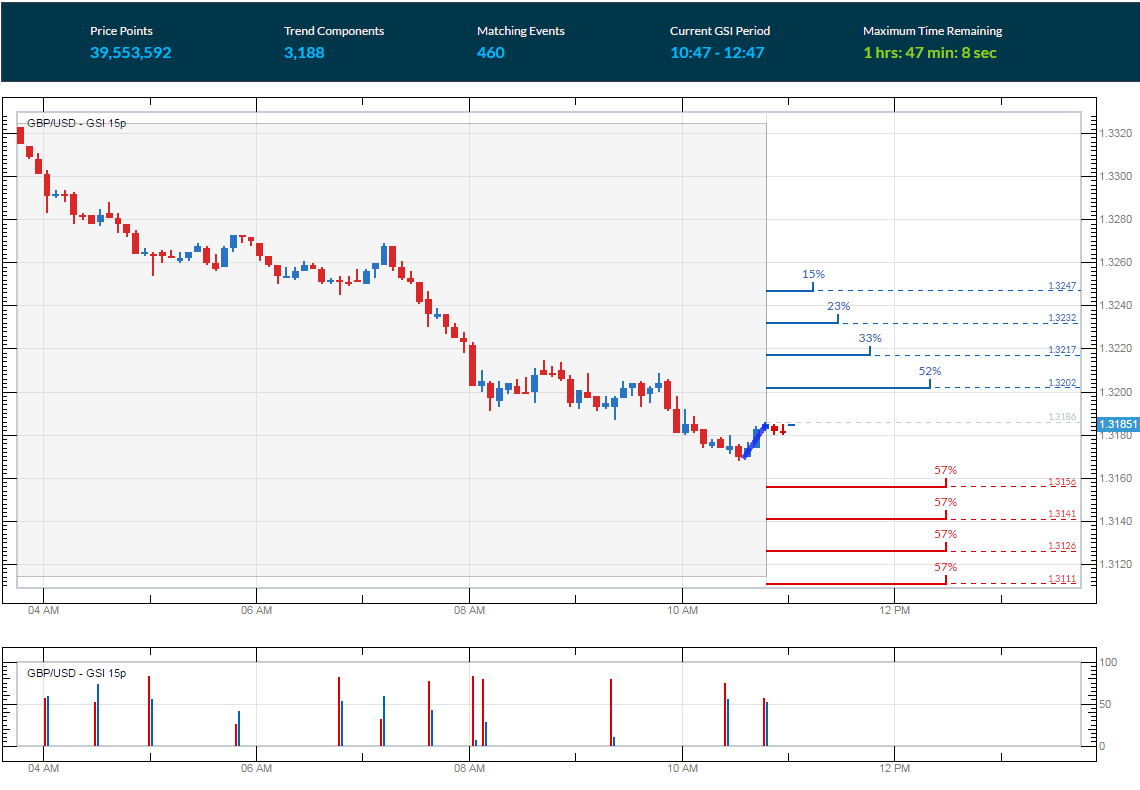
In the 5-minute graph below, the GBP/USD can be seen trading off its current daily lows. The Grid Sight Index (GSI) is currently viewing this move as a short term uptrend, as the pair has put in place a series of higher highs in the last hour of trading. After reviewing 39,553,592 pricing points, GSI has indicated that price action has declined by 30 pips or more in 57% of the reported 460 matching historical events. It should be moated that a decline through today’s first bearish historical distribution at 1.3156 would place the Cable at new daily lows. This would suggest that the current short term uptrend was merely a retracement, and traders may begin looking for further price declines.
Alternatively, GSI has indicated that prices have advanced by 16 pips or more in 52% of the 460 historical matches. Today’s first bullish historical distribution is found at 1.3202. A move through this value would be significant, as it would suggest that the GBP/USD is attempting to fade this morning’s decline. In this scenario, traders may look for prices to test key values of resistance including 1.3200 and 1.3215
Want to learn more about GSI? Get started learning about the Index HERE.
To Receive Walkers’ analysis directly via email, please SIGN UP HERE
See Walker’s most recent articles at his Bio Page.
Do you know the biggest mistake traders make? More importantly, do you know how to overcome the biggest mistake? Read page 8 of the Traits of Successful Traders Guide to find out [free registration required].
Contact and Follow Walker on Twitter @WEnglandFX.


