


Talking Points
-Gold prices have been trading inversely to Fed rate hike expectations
-Gold prices test channel resistance, but don’t break higher
-The 9 month trend line near $1300 is the key level for bulls and bears
Fed rate hike expectations are essentially unchanged from before last week’s weaker than expected jobs report to now. This is an interesting development because once last Friday’s Non-Farm Payroll report was released, gold prices began to rally. Gold price rallied because the expectations for a rate hike began to soften.
Since then, rate hike expectations began to increase again and are back up to similar levels as last week. This is important because lately gold prices tend to move inversely with rate hike expectations. If there is an expectation for increased rates, then traders will seek out other assets which produce a yield. If rates are expected to remain low, then gold appears more attractive since it doesn’t deliver a yield.
That would explain why we saw the large rally fizzle into a dip. As the rate hike expectations elevate back up towards last week’s levels, gold prices are selling off.
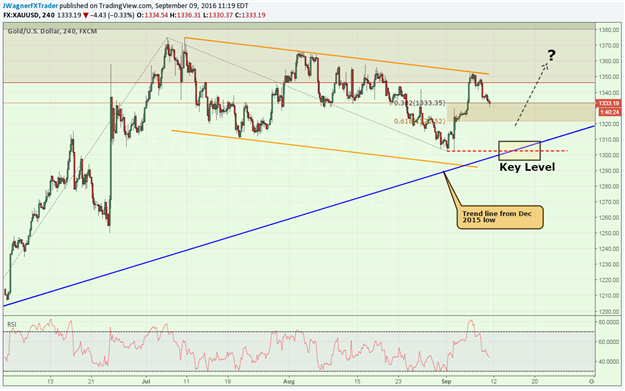
Taking a look into the technical picture for gold prices, the failure to break above the orange resistance line is something to keep an eye on. The move lower since July 6, 2016 appears to be a correction that would likely become fully retraced to the upside. However, was the failure at the resistance line simply a pause to gather energy to break higher?
Looking at the intraday internals, support levels loom near $1320. If we see a bounce higher near this level that breaks above the orange resistance line, then bulls can get excited for a potential move towards $1375 or $1435.
On the other hand, gold prices are comfortably holding above the 9 month trend line. A break below the blue trend line suggests a much deeper retracement is underway towards a retest of $1200. This blue trend line is near $1300.
Bottom line, if gold prices can hold above the blue trend line and especially $1320, then a break higher above $1351 opens the door to much higher levels. The failure of the blue trend line to hold near $1300 suggests a sell off towards $1200.
Suggested Reading:
DJIA Falls Towards Key Level 18,295
Gold Prices Test 9 Month Trend Support
To read our quarterly forecasts for Gold or, download our quarterly forecast here.
See gold trader positioning here.
Experiencing more losing trades than winning trades? This could be why.
---Written by Jeremy Wagner, Head Trading Instructor, DailyFX EDU
Follow me on Twitter at @JWagnerFXTrader .
See Jeremy’s recent articles at his Bio Page.
To receive additional articles from Jeremy via email, join Jeremy’s distribution list.


