


Talking Points
- Crude Oil Prices Decline on Disappointing ISM Data
- Daily Support for Crude Oil is Found at $43.50
- If you are looking for more commodity trading ideas? check out our Crude Oil Trading Guide
The price of Crude Oil continues to decline this morning on worse than expected ISM Non-Manufacturing data. Expectations were set at 54.9 for the event, but were released at 51.4. Today’s decline in Crude prices marks the sixth decline in the last eight sessions. Now, Crude Oil is closing in on a daily trendline near $43.50. This point is acting as a point of support, and a break below it would add to the commodities mounting weakness. Alternatively, a bounce near present prices may suggest a return towards the next value of daily resistance near $46.25.
Are traders long or short the market Find out here !
Crude Oil Prices, Daily Chart & Trendline
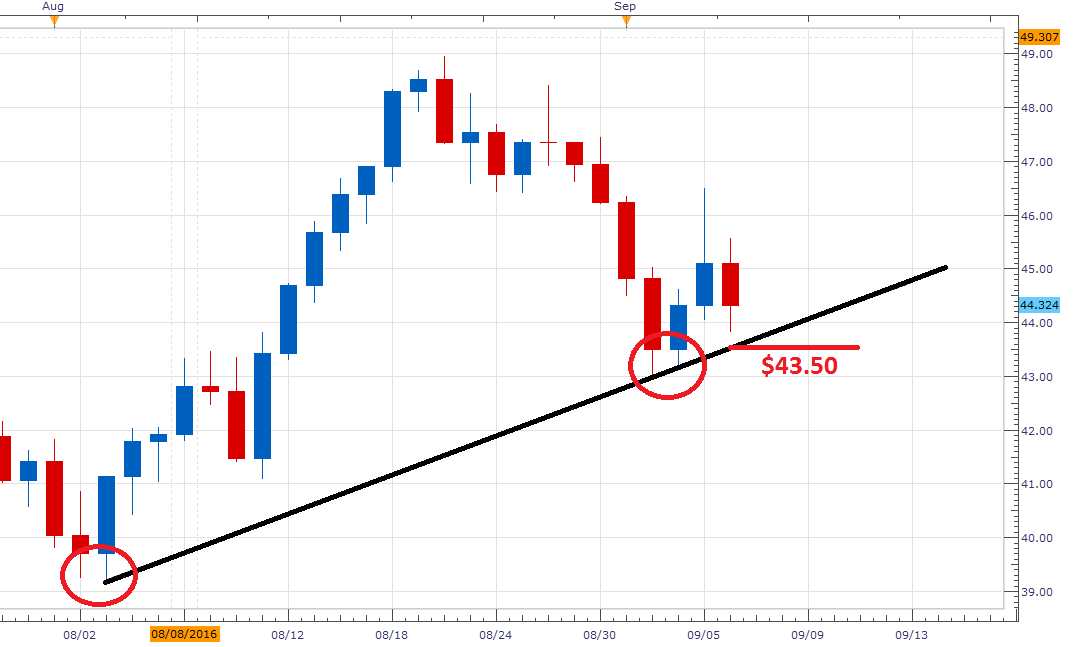
Chart prepared by Walker England
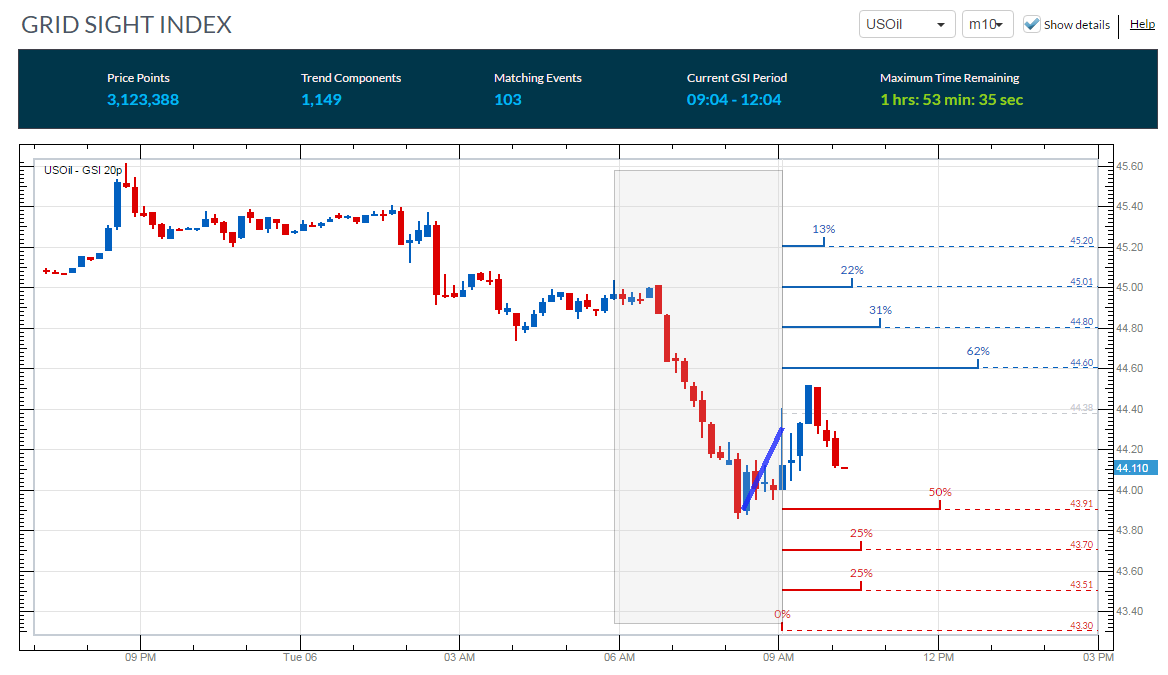
In the 10-minute graph below, we can see Crude Oil prices advancing off of their daily lows at $43.82. The Grid Sight Index (GSI) however has identified this retracement as a short-term uptrend with the creation of a new short-term swing high at $44.50. After reviewing 3,123,388 pricing points, GSI has indicated that prices have advanced $0.22 or more in 62% of the identified 103 matching historical events. This places today’s first bullish distribution for Crude Oil at a price of $44.60. Traders looking for a reversal of this morning’s decline should first look Crude oil to test this point, then move on to next resistance near $45.00.
Alternatively, the first bearish distribution for Crude Oil prices is found at $43.91. GSI has indicated that prices have declined by $0.47 or more in 50% of the matching 103 historical events. A move through this value would suggest a resumption of this morning’s downtrend, and open up prices to again test the daily low at $43.82.
Want to learn more about GSI? Get started learning about the Index HERE.
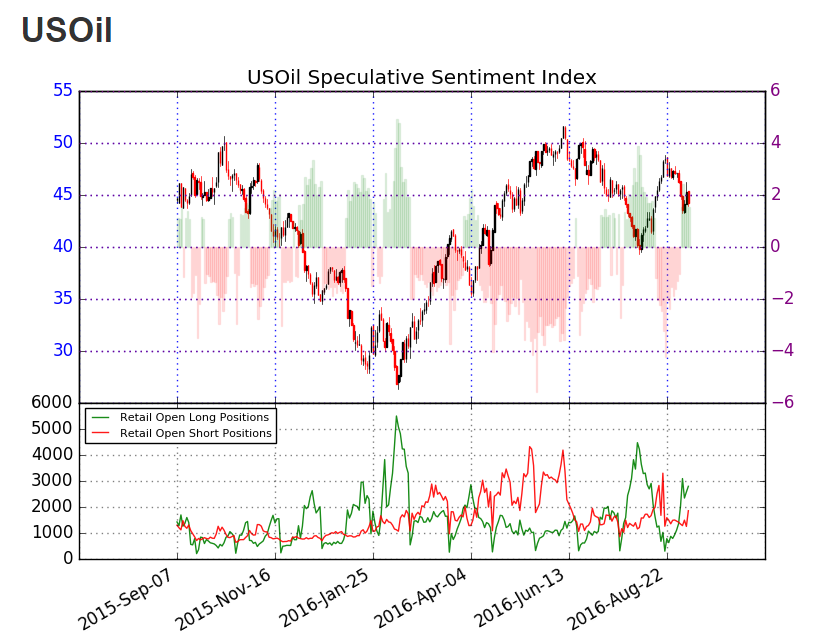
The ratio of long to short positions for Crude Oil (Ticker: USOil) stands at +1.52. With 60% of traders positioned long, this SSI (speculative sentiment index) reading is typically suggests that Crude Oil prices may continue to trade lower. In the event that Gold trades to new weekly lows, traders should look for SSI to move towards positive extremes of +2.0 or more. Alternatively, in the event of bullish reversal, traders should look for SSI to move back towards values that are more neutral.
To Receive Walkers’ analysis directly via email, please SIGN UP HERE
See Walker’s most recent articles at his Bio Page.
Contact and Follow Walker on Twitter @WEnglandFX.


