


Searching For Concise Recommendations That Can Improve Your Trading Skills? Then Our Traits Of Successful Traders Guide Is An Excellent Material For You! Obtain Them HERE
Talking Points:
- August represented the least volatile month so far during 2016 for AUD/CHF
- Price action currently hovering above support level on symmetrical triangle
- Will September test resistance levels of AUD/CHF ascending channel?
Introduction:
August is well known by being one of the months with the lowest trading activity during the year and for AUD/CHF, it was not the exception.
The cross poses to close the trading month relatively unchanged as AUD/CHF only advanced by 0.44% establishing August as the month with the lowest movement so far this 2016. March accounts the highest change with a 3.30%.
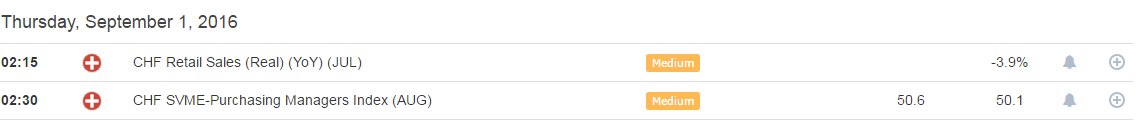
However, September is around the block and during the first days of trading of the month, we have some economic fundamentals being released. Events such as Switzerland’s GDP and BoA rate decision that could put momentum to the cross that is currently trading close to interesting technical levels explained below.
Short-Term Technical Outlook:
As observed in the chart below, during the second part of August, trading took over the confined limits of a symmetrical triangle. As of Wednesday’s afternoon, AUD/CHF is hovering above support line of the previously mentioned pattern. Therefore, as it is common with symmetrical triangles, price is expected to bounce from support line in the upcoming trading activity in order to search resistance levels delimited by the negative sloping line.
AUD/CHF 1 Hour Chart

Chart prepared by Quasar Elizundia
Bigger Picture:
AUD/CHF Daily Chart
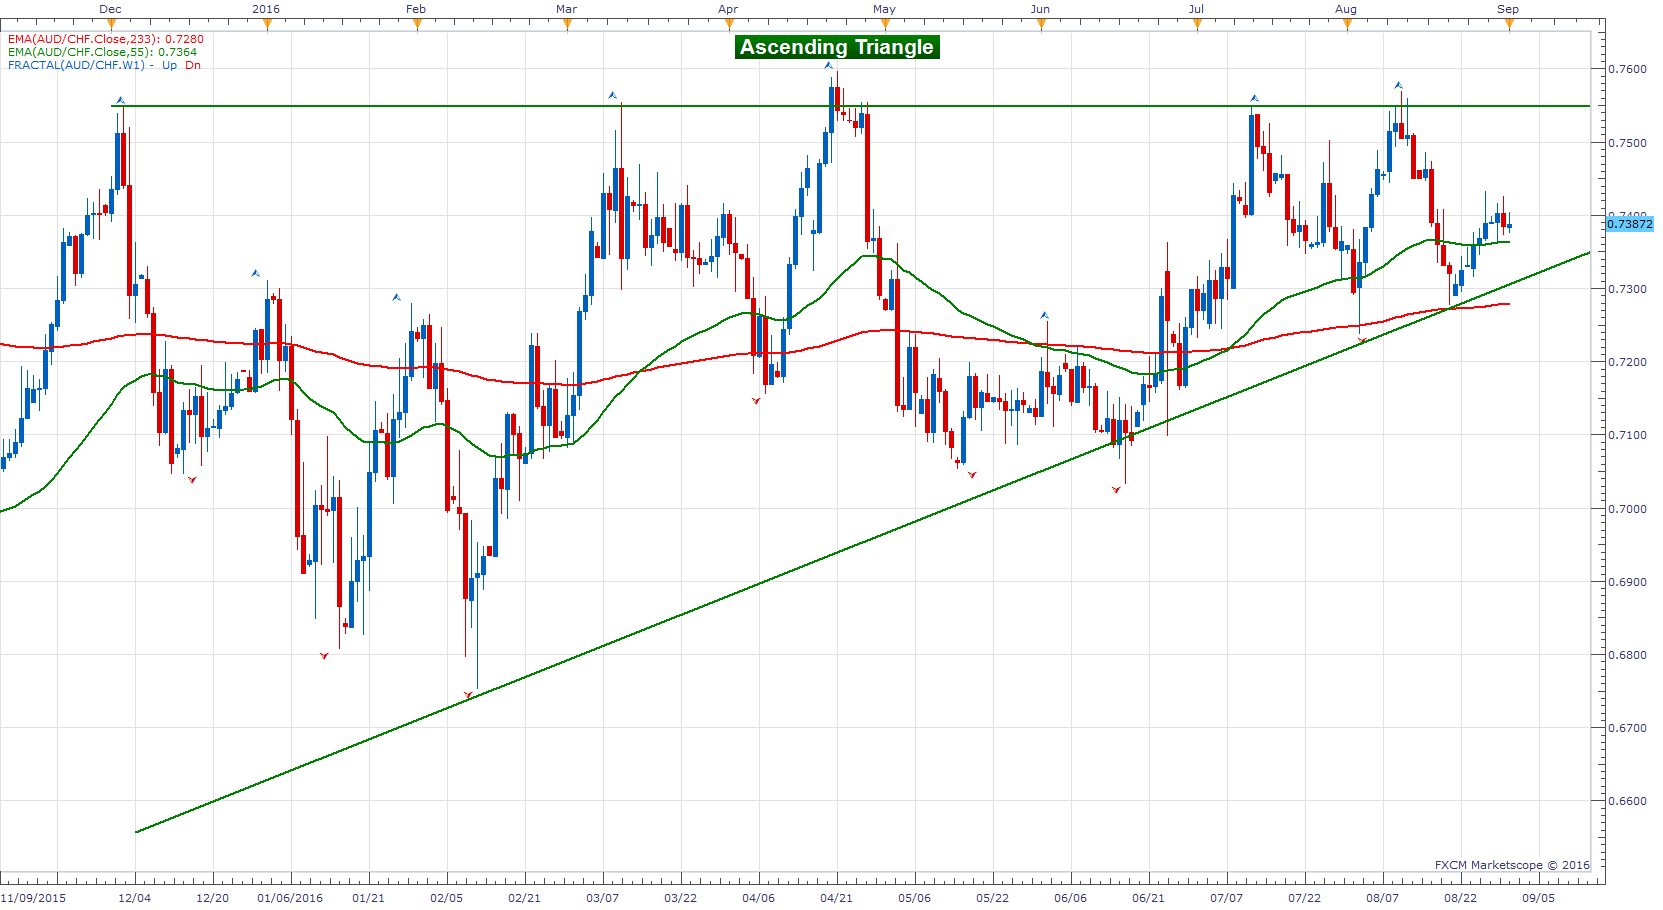
Chart prepared by Quasar Elizundia
In a bigger picture, we can observe in the chart above that AUD/CHF has been registering a series of higher lows but highs have been limited at a strong resistance level around the 0.755 price level. This price action pattern receives the name of “Ascending Triangle”. Ascending triangles are characterized by having a strong resistance level from which prices fail to break and retrace back below resistance level. However, prices fail to register lower lows and instead price action is confined continuously to a smaller area with frequent higher prices without breaking the established resistance level. This process continues until price action is capable of breaking a strong resistance level.
During August, AUD/CHF tested both, resistance and support levels of the above mentioned pattern and during this time, the 55 EMA and the 233 EMA played a role as additional support levels. Currently the 55 EMA seems to be providing good support for the cross and given that price is currently trading above both moving averages momentum remains in the bull side.
Bottom Line:
Given that currently we are sitting at support on the 1 Hour chart and that in the bigger picture, we have been trading in a bullish pattern, expectations are that the cross bounce from support in order to target resistance levels of the symmetrical triangle. In case, prices do bounce from support and get to resistance levels, there is a high possibility this movement could lead to a potential bullish breakout, as price action seems to be reaching the end of the area of this pattern setting AUD/CHF in search again of resistance levels of its ascending triangle.
As a contrary perspective, instead of bouncing from support, AUD/CHF breaks to the downside the symmetrical triangle pattern and sets momentum to the downside. In this case, traders should target the daily 55 EMA as the next support level in which bullish entries should be considered.
Economic Fundamentals to focus for AUD/CHF

Are you interested in knowing what are the Top Trading Opportunities of 2016? CLICK HERE !
Are you a scalper? Then GSI is a tool that could help you on your short-term trades! Check it out HERE
Written by Quasar Elizundia


