


Talking Points
-EU Referendum vote (Brexit) is coming in 13 days (June 23)
-GBP/USD approaches trend channel support near 1.4300
-Use the Grid Sight Indicator to pin point shifts in intraday momentum
A swan dive can be an elegant way for a diver to enter the pool. However, a few miscalculations and the result is less than elegant. As the EU Referendum vote, more popularly known as “Brexit” vote approaches, GBP/USD has been steadily trading lower and is now faced with a 3 month support channel. If a technical bounce takes place, then price elegantly trades higher. If price breaks lower, then the positive price mood since February 29 has changed and the exchange rate could dig a deeper hole.
Volatility has been picking up for Sterling in anticipation of the vote and it is reasonable to expect volatility to be heightened around the day of the vote on June 23. In addition to Brexit, FOMC delivers their latest round of monetary statements on Wednesday June 15. Needless to say a lot of event risk is coming up for GBP/USD.
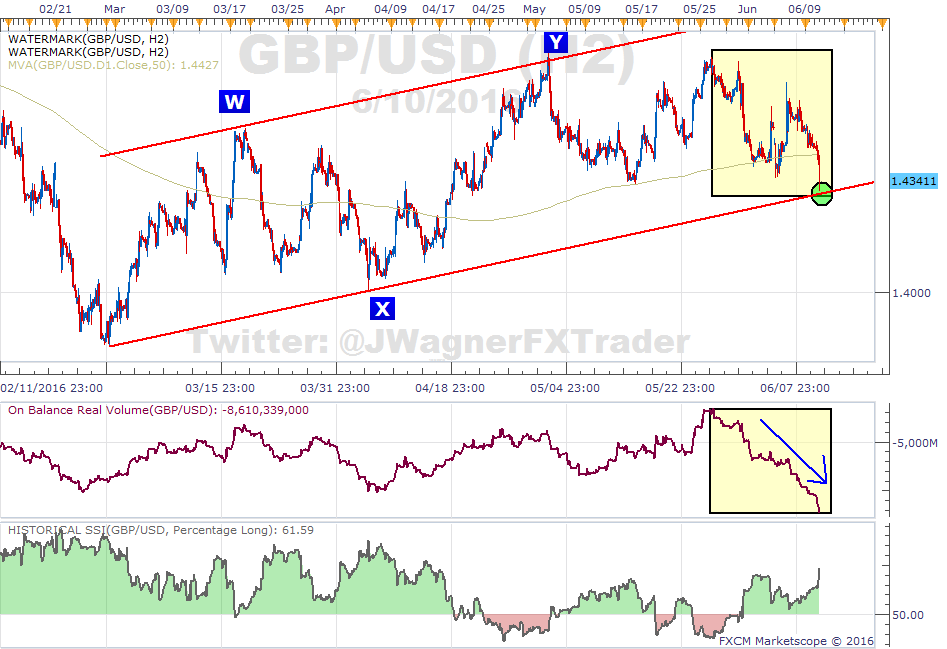
Chart prepared by Jeremy Wagner
As we technically alluded to above, GBPUSD has been grinding higher since March. This move higher does appear to be corrective as it is littered with 3 wave overlapping zigzag waves.
The recent weakness from late May is merely pushing the pair closer into a technical ‘hot spot’. A hot spot is an area where something is going to give and it affords the trader an opportunity at a good risk to reward ratio trade.
In this case, GBPUSD has been trading in an upward sloping trend channel. The support level of the trend channel comes into play near 1.4300. Therefore, it is feasible for a technical reaction to take place and push the exchange rate higher. However, if the support level breaks, then it indicates the mood of the market is changing from when the corrective channel began on February 29.
Considering other technical tools, On Balance Volume (OBV) shows a weakening trend. That means the volume to downside has far outpaced the volume to the upside. Notice in the yellow box on the chart how OBV has barely reacted upward even though price has been choppy. This is a bearish symptom.
Going into the hot spot, we are leaning towards a bearish break, though a technical bounce could certainly occur for this 3 month trend channel.
Therefore, we can use the Grid Sight Indicator (GSI) to help determine shifting momentum and potential signals in the noise if the pair enters into this hot spot.
To determine if a bearish reversal or a continuation is taking place in this hot spot, consider:
- What the Grid Sight Indicator is saying about momentum
- Is Sentiment (measured through SSI) shifting in one direction or the other?
Grid Sight
Look at GBP/USD (or even GBP/JPY) through the Grid Sight website with the chart setting of ‘m3’ or ‘m5’. As price enters the potential reversal zone, see how GSI is reacting such that we want to see the historical patterns heavily shifted in one direction.
Note, GSI is NOT a news trading indicator. DO NOT USE GRIDSIGHT during the release of news events. Wait until after the news event to begin seeing what the indicator is suggesting for momentum.
For those that are unfamiliar, GridSight is a powerful big data indicator that can give you a look at the market by analyzing millions of historical prices in real time. By seeking out similar patterns, GSI helps you use that data to trade important levels coming up.
Speculative Sentiment Index (SSI)
Additionally, as price is pressing into a potential reversal zone, see if SSI is shifting. At the time of this writing GBP/USD SSI is running at +1.58. If the SSI reading shifts lower and possibly into negative territory, then it suggests a bullish reaction and possible rebound. If the SSI reading shifts higher, then it suggests a bearish breakout lower.
Depending on how GSI and SSI are behaving around this hot spot can provide us clues of these resistance levels are going to hold or break.
Above, we mentioned how a hot spot offers a trader an opportunity of a positive risk to reward ratio trade. We studied millions on live trades and found when a positive risk to reward ratio is used (which every trader has control over), traders who implemented that one technique were three times more likely to turn a profit versus those who did not implement the rule.
Lastly, there are some risks to be aware of on the approaching referendum vote. First, weekend gap risk is huge right now. A new poll could be released over this weekend or next weekend showing a change in behavior that jumps the exchange rate.
Also, there is a chance of highly illiquid conditions meaning it is difficult to get into or out of positions. That makes managing the trade more challenging as the day of the vote approaches. Eventually, liquidity will return so consider your plan now of avoiding GBP in the days leading up to and the day of the vote.
Lastly, in a culmination of these risks, margin requirements are going up. Therefore, those traders who plan on trading GBP will need to be well capitalized traders.
Good luck!
---Written by Jeremy Wagner, DailyFX Education
Follow me on twitter at @JWagnerFXTrader .
To receive additional articles from Jeremy, join his email distribution list.


