


Talking Points:
- Price is more likely to bounce when in a range
- Swing highs/lows can act as support and resistance
- Trade these potential bounces with a positive risk:reward ratio
Trying to pick tops and bottoms when trading is very difficult. There is no sure-fire way of knowing when a price move will stop and reverse. But there are a couple of methods we can use to give us a better shot at trading price bounces successfully. This strategy combines the ADX indicator, support & resistance levels, and a positive risk:reward ratio.
Is This Pair Ranging?
This can be a difficult question to answer, since we all have different methods of judging the market condition of a specific pair in a specific time frame. The term "range bound" is fairly subjective and means different things to different people. In an attempt to quantify this market condition, we will use the Average Directional Index or ADX(14).
This indicator initially looks like a traditional oscillator with a single line that oscillates up and down, but that's where the similarities end. Rather than displaying the strength or weakness of a currency pairs' price action, it displays the strength of a currency pairs' trend. This means it is direction neutral. It only measures if a pair is trending (up or down) or is moving sideways.
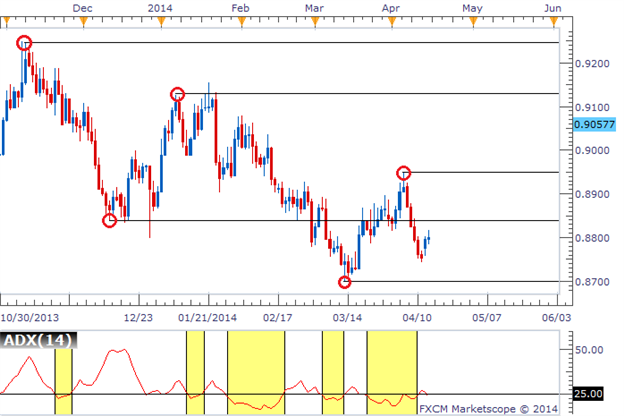
Learn Forex: The ADX(14) With Highlighting Below 25

(Created using Marketscope 2.0 charting package)
The higher the ADX reads, the stronger the uptrend or downtrend is. But since we are focusing on trading bounces, we are more interested in times where the ADX is below 25. We can see in the chart above, when price begins to move more sideways, the ADX falls below 25. Then when price begins to move predominantly up or predominantly down, the ADX moves above 25 and beyond. It's during the times that the ADX is below 25 that we want to trade bounces. This increases the likelihood that we will successfully call a reversal.
Drawing Support and Resistance Lines
The most difficult part of this strategy for most people is drawing support and resistance levels. For an in depth discussion on drawing these levels, I recommend reading 3 Simple Ways to Identify Support and Resistance in Forex. This will catch you up to speed.
Today, we will be using prior swing highs/lows as the areas where price may bounce. We can use the line tool on Marketscope to draw horizontal lines each time price makes a significant high or low price and then reverses. The idea in identifying these levels is that they could act as support and resistance levels in the future just like they did in the past. On the chart below, we identified 5 key levels that price has bounced off of in the past and extended horizontal lines out into the future.
Learn Forex: Drawing Support/Resistance Lines
Trading the Bounce
The final step to this strategy is to witness price approaching one of the lines we drew on the chart while the ADX is below 25. Price has the potential to bounce off these lines when making contact especially when ADX shows price is range bound.
The chart below gave us two opportunities to trade this pair; once while price approached a resistance line, and another when price approached a support line. Both of these touches occurring when the ADX was below 25.
Learn Forex: Two Trade Entries Using ADX(14) and Support/Resistance

We can see that price did indeed bounce off of these lines and would have been successful trades, but that won't always be the case. Often times price will not bounce and will result in losses, so we want to make sure we manage the trades properly. For this, we recommend using a positive risk:reward ratio. So we want to set a relatively tight stop loss beyond the support/resistance line we are trading, and set a profit target that is at least twice as far as our stop loss (in pips). This will reduce our required win rate to be profitable and will assist in proper money management.
In Conclusion
Using these methods will increase the likelihood that price will bounce when we think it will. It won't always go as we plan, but using ADX, swing highs/lows and proper money management could tip the odds in our favor. If you would like to test these methods, download a Free Forex Demo account today with free charts and real-time pricing data.
Good trading!
---Written by Rob Pasche
Video Lessons || Free Forex Training
Trading Using Fibonacci (13:08)
Reading the RSI, Relative Strength Index (13:57)


