


Talking Points
- Fibonacci retracement zones can be used to determine when a correction in trend is over.
- Traders use Fibonacci retracement zones to pinpoint low risk well defined trade opportunities
- Fibonacci lines can be used to place stops and limits.
Catching a Ride on the Trend
Many traders struggle to “make the trend their trend” because they lack a consistent entry strategy for rejoining an established trend. It is commonly held that a trend does not move in a straight line. Rather, a trend expands and contracts much like the inhaling or exhaling of breath. This rhythmical pattern can be predicted mathematically by many Forex Traders based on set of Fibonacci ratios. This can help traders find low risk entries for trading with the trend.
Leonardo Pisano Bigollo, also known as Fibonacci,was a 12th century Italian mathematician who is credited for introducing the Golden mean to Western civilization. He used a problem that asked how many pairs of rabbits are created by one pair in one year to introduce the Fibonacci series.
The series goes like this 1,2,3,5,8,13,21,34,55,89,144,233,377. The first and second numbers are added to get the third number then the third and fourth numbers are added to get the fifth number and so on. So you are probably asking how do rabbits and number series give me a place to enter USD/JPY?
Well, these numbers are related to give us the Fibonacci ratios that traders use. Take the first number 1 and divide it by 2 to get 0.50. Take 21 and divide it by 34 to get 0.618, another retracement level and divide the alternating numbers like 13 and 34 to get 0.382 which is another Fibonacci level.
Applying these Ratios to a Trend
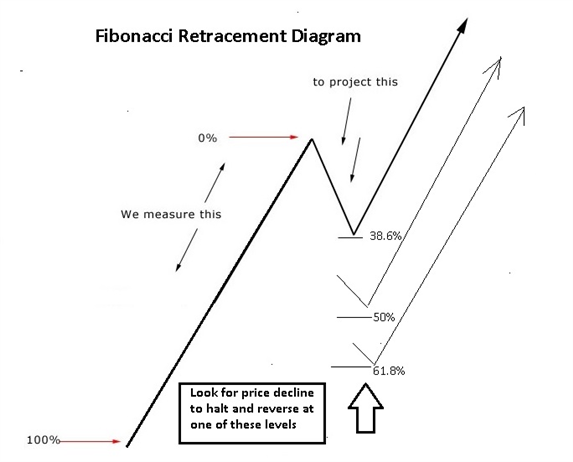
Like reproducing rabbits, a trend is a state of growth. So applying these ratios to an established expanding trend often reveal great areas to trade with the trend. These ratios act like signs on a street revealing where the next bus stop is likely to turn up. Notice in the diagram below how after a move higher, price is likely to pull back and rebound from one of these areas.
Trading Setup
The current trading setup shows a USD/JPY 4-hour chart uptrend swing that started on November 26th at 101.13 and stoppedat 103.36 on December 2nd. Though some traders may have missed this 225 pip rise, they can still have a second chance at joining this trend using the retracement ratios. In the chart below, we can clearly see that USD/JPY did not stop at the 23.6% Fibonacci level at 102.84. So we look to the next Fibonacci level at 102.51 which is the 38.2%. USDJPY could rebound from that level and we would need to watch this level. But the wide ranging red bearish candle may push right through the 38% Fibonacci straight down to the 50% Fibonacci level at 102.25. USDJPY spent 48 hours consolidating at this level so I am looking for price to rebound from 102.25.
Learn Forex: USDJPYFibonacci Bounce Trade Setup
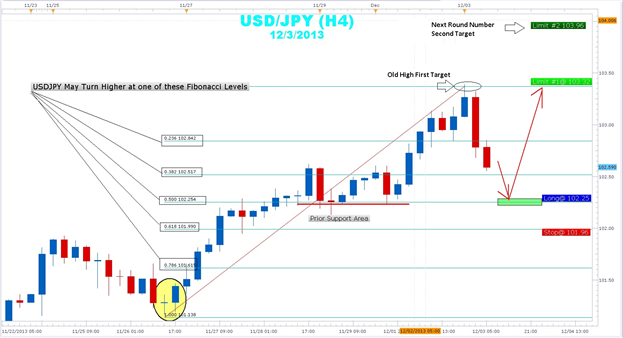
(Created using FXCM’s Marketscope 2.0 charts)
If this level holds, a stop can be placed below the 61.8% Fibonacci level after entering long around 102.25. The first target would be the old December 2nd high of 103.36. A breakout above that area could take USDJPY to the 104.00 area. There are two more Fibonacci levels, however, the deeper the correction the less likely the trend is to continue. Sometimes, price may turn just a few pips away from a Fibonacci level so it is also important to look at Fibonacci as zones of support and resistance rather than concrete levels.
In sum, traders have a great opportunity to rejoin a very strong USD/JPY uptrend using Fibonacci retracements. Grazie Leonardo!
---Written by Gregory McLeod Trading Instructor
To contact Gregory McLeod, email gmcleod@dailyfx.com
To be added to Greg’s e-mail distribution list, please click here.
Follow me on Twitter@gregmcleodtradr.
This article showed you how to use Fibonacci to trade USDJPY. I want to invite you to enroll in our free Fibonacci Retracement Course to further your understanding of Fibonacci. Sign our Guestbook to gain access to this course now!


