


Article Summary: Everything about Ichimoku works to help you determine where the likely price action will be should the trend continue. As a trend follower, you likely go against your gut instinct by entering at higher prices in anticipation of trend continuation. This can be tough but Ichimoku works to give you a clear picture of what will likely transpire based on recent price action.
Ichimoku provides traders with a “one glance” approach to analyzing the market. In essence in one glance, you should be able to see if market is trending or not. If markets are trending, then Ichimoku can help you see where support and resistance lay both now and in the future.
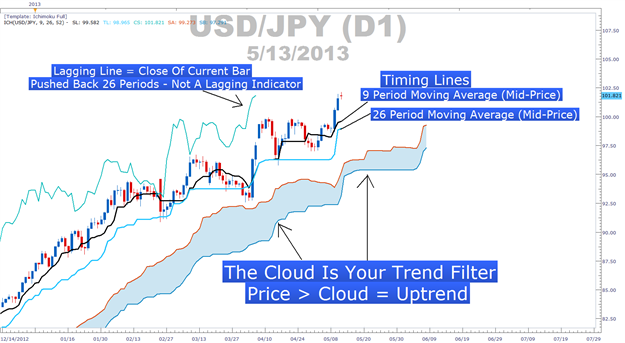
As we discussed in prior Ichimoku articles, the cloud gives you the ability to see if the trend is clear or not. Price above the cloud highlights an uptrend and price below the cloud highlights a downtrend. The two lines (trigger and base line) provide a timing element to entering in the direction of the trend.
Learn Forex: Ichimoku in Full on USDJPY
Ichimoku Strives To Be a Leading Indicator
Ichimoku has two fundamental functions that every trader should know. Is price trending today? The lagging line also helps you answer this because if the line (with its misleading name) is above price from 26 periods ago, then we’re technically in an uptrend and momentum should carry the pair higher.
The second function is to answer where price will likely go. This of course, is much more difficult to answer. More importantly, no trader should believe that Ichimoku has the definitive answer that no other indicator does which is where will price be a week, month, year from now.
Ichimoku simply takes very important time scopes and applies them forward and backwards so you have the full picture when trading the time frame of your choosing. The 26 number is unique to Ichimoku which was founded in Tokyo because there use to be 26 working days in a month and 26 is also half a year if you're on a weekly chart. An hourly chart would give you a little more than a full day of price action when 26 periods are applied.
So whether you are trading an hourly, daily, or weekly chart the 26 period time frames holds significance. The next level up is the 52 period midpoint which the opposing side of the cloud uses to tell you the midpoint of the current move over the last 52 periods. On a daily chart, that is telling you over the last quarter where mid-price would be and on a weekly chart, that would be over the last year of data the mid-price would be to give you the full picture.
How 26 Is Used With Ichimoku
Learn Forex: 26 Is Used To Circumvent Current Price Action

The 26 is used three times with Ichimoku because Goichi Hosada felt it encompassed the big picture when he created this indicator in the mid 20th century. 26 is used both behind and in front of price action. The 26 moving average with mid-prices is also used to help you see if now is a good time to be trading in the direction of the trend because when price is below the cloud and the base line (26 period moving average) it is considered a higher probability entry with the trend.
The reason Ichimoku is seen as a leading indicator is because the only thing looking back are the two moving averages. The two aspects of the cloud and the lagging line are used to help you see both momentum carrying forward and future support and resistance. The cloud is the projected future support and resistance and the lagging line helps you see a momentum push when the line breaks through support like we see above on AUDCAD.
Many of the best trades with Ichimoku come when the lagging line aligns with the big picture. Simply put, if lagging line “breaks out” that is showing you that momentum will likely carry the trade with the trend. Traders can still take trades when the lagging line doesn’t favor the trade but the higher probability trades will be when the lagging line agrees with the overall picture.
Ichimoku Trade: Sell EURCAD as EURCAD Has Shown Weakness near the Cloud’s Resistance
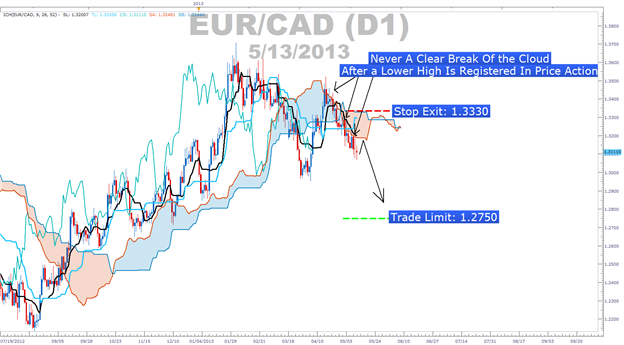
Ichimoku Trade: Sell EURCAD Based on Price Bouncing Off Cloud Resistance
This trade has the Lagging Line Signal just breaking out of price action from 26 days ago
Stop: 1.3330 (Resistance with Top of Cloud)
Limit: 1.2750 (Profit Target Greater In Pips than Stop Exit & At Monthly S2 on Classic Pivot)
If this is your first reading of the Ichimoku report, here is a recap of the traditional rules for a sell trade:
-Price is below the Kumo Cloud
-The trigger line (black) is below the base line (light blue) or is crossing below
-Lagging line is below price action from 26 periods ago
-Kumo ahead of price is bearish and falling (red cloud = bearish Kumo)
-Entry price is not more than 300 pips away from base line as it will likely whip back to the line if we enter on an extended move.
This trade was taken last week during our Live Webinar on Ichimoku and is currently in our favor. If you want temporary access, you can email me and I will show you how to register for free temporary access to DailyFX Plus where we host live webinars or follow the instruction below in the email’s signature. Lastly, when employing Ichimoku to spot good entries in the direction of a strong trend, failed cloud breaks provide a signal that price is too weak to move higher so any jolting move will likely be to the downside.
Happy Trading!
---Written by Tyler Yell, Trading Instructor
To be added to Tyler’s e-mail distribution list, please click here.
If you would like to attend the weekly Ichimoku webinar on Thursday morning at 930 ET, you’ll need access to Daily FX Plus.
Would you like dozens of trade ideas every day with updated charts to identify major levels support and resistance on the currency pair you’re trading?
If so, click here to learn more about our Technical Analyzer on DailyFX Plus.


