


Finding the short term trend and identifying market momentum are two important skills for those looking to utilize scalping strategies in the Forex market. Regardless of the strategy chosen, it is always important to have a trading bias to determine if we are looking to buy or sell a currency pair prior to moving in on a shorter term graph.
Below we can see an example of the EURJPY trading on a 5minute graph. Would you be a buyer or a seller at current market prices? For new traders this can become a hard decision with the limited amount of data at our immediate disposal. To help identify trading opportunities, today we will discuss looking at a broader range of price action by segmenting it into Building Blocks.
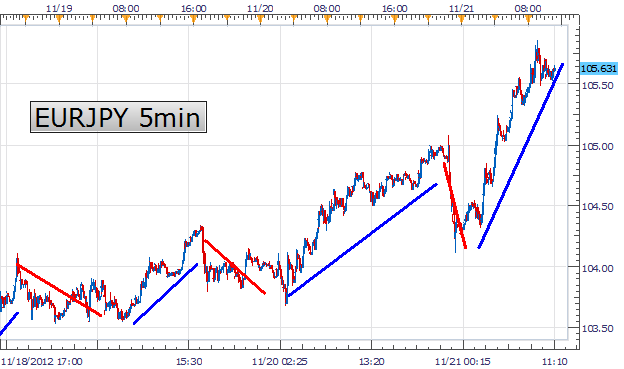
(Created using FXCM’s Marketscope 2.0 charts)
Building Blocks
Before scalping on shorter term graphs, many traders select to use a form of multi time frame analysis to decide market direction. Pictured below we have a 30minute EURJPY graph depicting approximately a weeks’ worth or price action. Notice how the graph has been segmented into two distinct trading blocks. They have been created by identifying the previous Sunday and Wednesdays on the chart. Drawing a Building Block on Market Scope 2.0 is relatively straight forward by using the vertical line function under the insert menu. Once you have created one line, you can cut and paste the others on the appropriate dates in order to begin your analysis.
The purpose of starting with a larger time frame, and then moving down to a smaller chart, is to fragment our analysis and ensure that price is heading in a continuous trending direction. If a block is printing higher highs and higher lows, it will be colored blue indicating an uptrend. If price is making lower highs and lower lows it should be colored red indicating a downtrend. If you have identified a strong trend, both Block 1 and Block 2 should be moving in the same direction and painted in the same color. If you find yourself looking at two different colored blocks, this is a strong sign that there may be no clear trend. At that point if you have no market bias it is time to move to a new chart for potential scalping opportunities.

(Created using FXCM’s Marketscope 2.0 charts)
Block Interpretation
Now that we have our building blocks built into our graphs, it is essential to know how to interpret them. The analysis for Block 1 begins on Wednesday November 14th. At this point in time the EURJPY printed its standing low for Block 1 at 100.83. By its conclusion price had rallied as much as 306 pips up to the Block 1 high at 103.97. Once momentum to the upside is confirmed this block should be colored blue.
Remember when it was said that the strongest trends have both Building Blocks trending in the same direction? The chart above also depicts that Block 2 has been colored blue as well, signaling the continuation of an uptrend. From Sunday November 18th through Wednesday November 21st, price printed higher up to 104.82, without creating a lower low. With our Building Block analysis complete, we now know that we should only be looking to buy the EURJPY with the scalping strategy of our choice. Traders will look for momentum to carry through the rest of the week, at which point a new block will be formed and our analysis will begin again.
---Written by Walker England, Trading Instructor
To contact Walker, email instructor@dailyfx.com. Follow me on Twitter @WEnglandFX.
To be added to Walker’s e-mail distribution list, CLICK HERE and enter in your email information.
Want to learn more about trading CCI? Take our free CCI training course and learn new ways to trade with this versatile oscillator. Register HERE to start learning your next CCI strategy!.


