


The ruler tool is one of the most popular features of Marketscope 2.0 and it is used many times a day by traders. First, we will point out the biggest feature of the ruler tool and where to find it on the charts. Then, we will share one way to use it in trading.
(Created with FXCM's Marketscope 2.0 charts.)
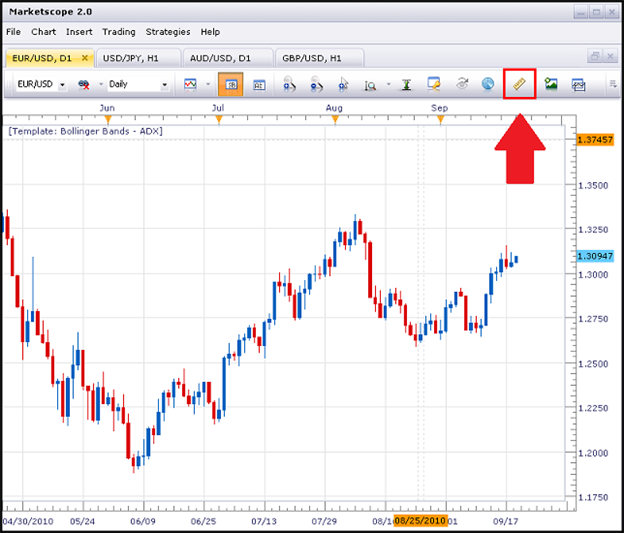
Having the ability to quickly measure the distance between two points on the chart is a great way to speed up analysis. Whether you want to measure in pips or time, the Ruler tool on the MarketScope 2.0 charts will allow you to easily do so. You can find the ruler tool to the top right in the toolbar.
(Created with FXCM's Marketscope 2.0 charts.)
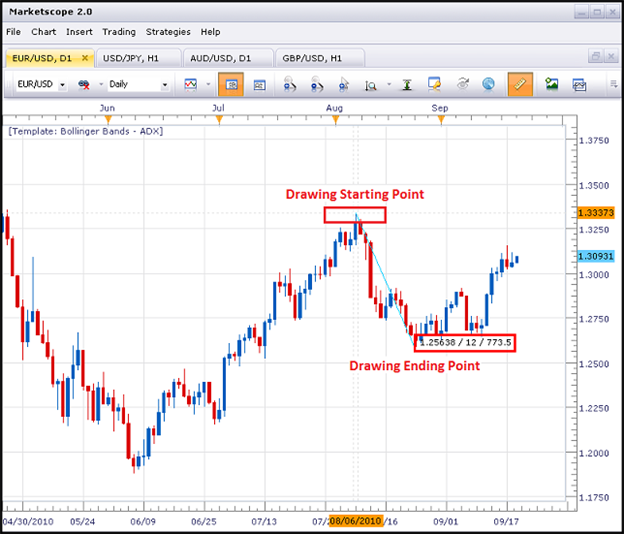
Left click and hold down on left click from where you would like to start measuring from and drag the mouse to where you would like to end your measurement.
The number on the left (1.25638) will show you what price your mouse is sitting on. The number in the middle (12) will show you how many periods your mouse has travelled across (in this case 12 days). The number on the right (773.5) will show you many pips your mouse has travelled across. Already you can see how one can use the ruler tool to measure trends or highs to lows, see how large they were and how long it took for a trend to reverse.
In our DailyFX Courses, we constantly talk about establishing your maximum risk by deciding where to set your stop loss. One way to set up stops when entering the market long is to establish them below the recent lows or below recent support levels. One way to set up stops when entering the market short is to establish them above the recent highs or above recent resistance levels. The ruler tool helps us quickly determine how wide we can set our stops in terms of pips.

(Created with FXCM's Marketscope 2.0 charts.)
Above is an example of entering the market long. Let's say that by using a basic Moving Average strategy, at the close of the Daily Candle on 07.04.2012 at 17:00 EST we decided to enter Long USDCHF at 0.95920.

(Created with FXCM's Marketscope 2.0 charts.)
As previously mentioned one way to set up stops for long positions is to set them up below recent lows or below recent support levels. In the image above the ruler tool is used to measure the distance from the entry to where a potential stop could be set at (below a recent low) to be about 185 pips away.

(Created with FXCM's Marketscope 2.0 charts.)
Now that we’ve established where a stop could be set based on market conditions we can determine where we could set up a limit using positive risk to reward ratios. In our Traits of Successful Traders series and in our online courses, we recommend using at least a 1 to 2 risk to reward ratio. We can use the ruler tool to measure where our limit will land on the chart and decide what type of risk to reward ratio we want to use.

(Created with FXCM's Marketscope 2.0 charts.)
Above is an example of entering the market short. Let's say that by using the same strategy, at the close of the Daily Candle on 07.04.2012 at 17:00 EST we entered Short EURUSD at 1.25245.

(Created with FXCM's Marketscope 2.0 charts.)
As previously mentioned one way to set up stops for short positions is to set them up above recent highs or above recent resistance levels. In the image above the ruler tool is used to measure the distance from the entry to where a potential stop could be set at (above a recent high) to be about 185 pips away.

(Created with FXCM's Marketscope 2.0 charts.)
Now that we’ve established where a stop could be set based on market conditions we can determine where we could set up a limit. In the image below the ruler tool is used to measure a 1:2 risk to reward ratio.
---Written by Julius Mendoza
To contact Julius, email instructor@dailyfx.com
Want to learn how to better identify the trend? Save hours in figuring out the overall trend by taking our Moving Average Trading course.
Take this free 14 minute “Moving Average” course presented by DailyFX Education. In the course, you will learn how to filter worthwhile trends, identify support and resistance, and find which entries give you the highest probability trades.
Register HERE to start your FOREX learning now!


