


To insure that I am taking higher probability trades, those that are more likely to hit my profit target, I will look at the amount of room the pair has to move in the direction of my trade. If there are numerous levels of support or resistance the pair has to move through, the less likely the profit target will be hit.
If there is little or no support or resistance in its path, the pair will have a greater probability that the profit target (limit) will be hit.
Let’s take a look at the daily chart of the EURNZD pair below…
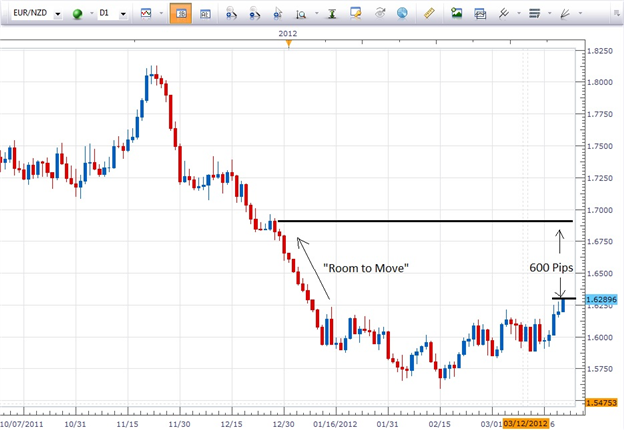
The pair has been building higher highs and higher lows for about six weeks. It has taken out the initial resistance at 1.6249. Should the EUR continue to strengthen against the NZD the pair has the potential and the “room to move” up for around 600 pips.
Now, this is not to say that the pair will take off like a rocket if bullish momentum continues or even that it will slowly trade up to our limit at roughly 1.6930. It may do neither of those. This chart merely shows a setup that in my mind that has potential…a greater likelihood of success.
On the other hand, let’s take a look at the one hour chart of the USDCHF pair below…

Notice how this pair has retraced to the downside and is building back to the upside. The entry on this trade would be when price breaks above about .9170…the thick black line just below where it shows “25 pips”. The assumption here would be that with a bullish bias after a retracement, the pair potentially could trade back up to its former high for a gain of around 180 pips.
Contrary to our EURNZD chart however, which showed the pair had “room to move”, this USDCHF pair is confronted with two levels of resistance on the way to its profit target.
So when trying to determine the likelihood of a profit target being hit, be certain to check out the charts with an eye toward how much interference price must go through to achieve its goal. The more interference (resistance levels in an uptrend and support levels in a downtrend), the less likely it becomes that the goal will be achieved.
Remember, as is the case with many aspects of trading, there is no absolute, hard and fast answer to the question of insuring that the profit target will be hit. There are no guarantees.


