


Think of a trading channel as a horizontal trading range being turned at an angle. Where the range is trading between relatively defined levels of support and resistance over time, the angular channel is either making higher highs (ascending channel) or lower lows (descending channel) as price action moves on the chart.
On the charts below are examples of both ascending and descending trading channels…
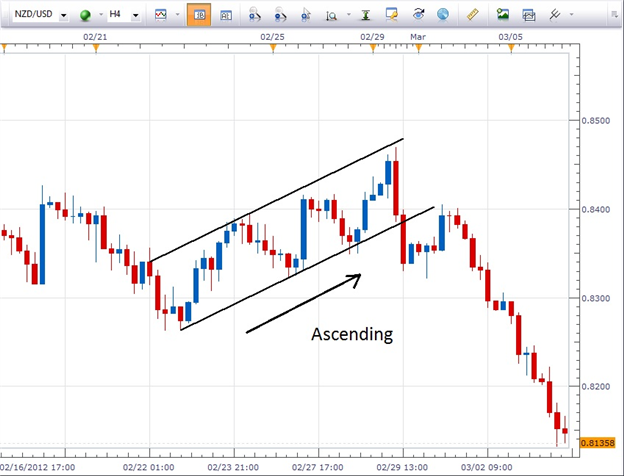
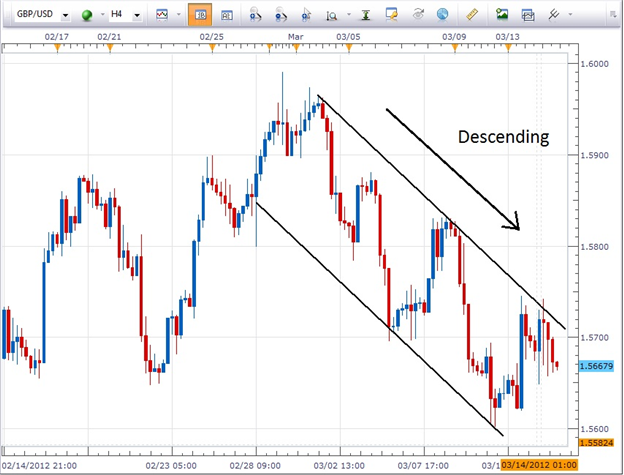
By looking at both of these channels, one can readily see the similarities between a channel and a range that was mentioned earlier. Just as in range trading, the lower channel line is considered support and the upper channel line is considered resistance.
Given that, as you might suspect, some of the same trading rules will apply.
However, before we begin actual trading, we must be certain to validate the channel. To accomplish this we will use the “Three Touch Rule”.
In other words, price action must come into contact with the lower channel three times before a long position can be taken. Also, before a short position can be taken, price action must come into contact with the upper channel line at least three times.
The rationale behind the three touches is that any two points on a chart can be connected by a straight line. Those two touches may be the beginning of a valid line or they may turn out to be nothing. However, if three points on a chart can be connected by a straight line, now we know that that particular price level is providing support or resistance. It is not as random as a line created by only two points.
Let’s take a look at the 4 hour chart of the GBPUSD descending channel for an example of this rule…
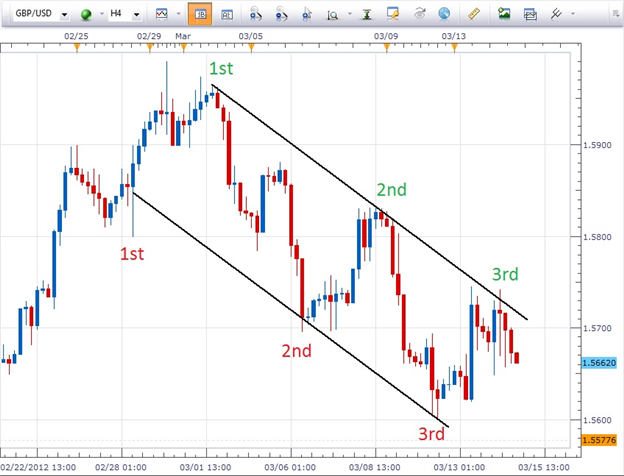
In the case of the chart above, a trader could take a short position on this GBPUSD pair after price tests the upper channel line (resistance) for the third time. Since the channel is descending and the daily trend on this pair is to the downside, shorting the pair is the higher probability trading scenario.
While some aggressive or impatient traders may take a trade after two touches, personally I prefer to wait for the greater confirmation that the third touch provides. (Keep in mind that greater confirmation is simply that: confirmation. It is not a guarantee that the trade is going to work out.)
I also want to point out that on the chart above that there are several places along the channel lines at which several candles come into contact with the channel line at virtually the same point…the second touch on the upper channel line for example. In a case such as that, that would count as a single touch. We want to see a touch occur and then have price action pull away and then come back and test the same level again. That will provide the greater validity that we are seeking.
Let’s use the 4 hour chart of the NZDUSD ascending trading channel for an example of how to enter a trade and place our stops and limits…
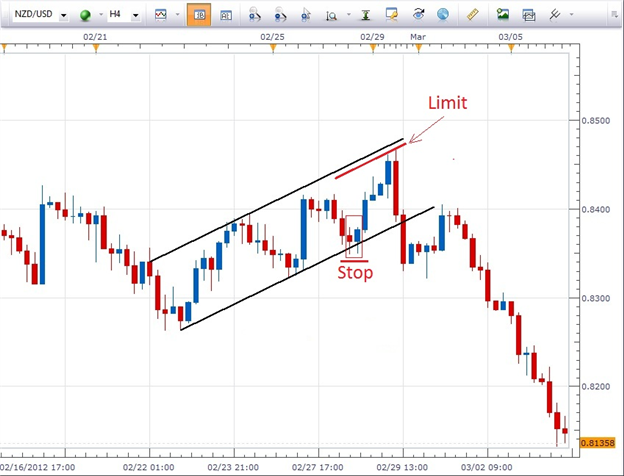
So in the case of this ascending trading channel, a trader could go long after the third touch of the lower channel by price. Price is respecting the support presented by the lower channel line. We can see that the two candles within the red rectangle and just above the word Stop have “wicked below” the channel line but have not closed below it. That is a good indication that a long position can be taken with a stop placed just below those two wicks.
The timing of our entry into this trade can be determined by the candlesticks that are forming along the lower channel line and/or an oscillating indicator such as Stochastics, MACD, RSI, etc.
In channel trades such as the one above, I prefer to set my limit just below the upper channel line. This is denoted by the red line labeled Limit. I do this since oftentimes price will move in the direction of the trade but it can fall just short of the upper channel line…as it did here. In this case, I would have captured perhaps 80-90% of the move which is just fine with me.
Next: How to Use Trendline Support or Resistance to Enter a Trade (31 of 47)
Previous: How to Trade Trendlines


