


In a recent webinar we were commenting on “selling on rallies” in a downtrend. (Essentially, that means a trader would wait for the pair to retrace against the trend, wait for it to stall and then sell the pair back in the direction of the Daily trend.)
The question was asked, how does a trader know (by the way, we never know for sure) when price action stalls that it is going to move back in the direction of the trend. My comment was that I would look for reversal candle patterns such as a morning star, evening star, spinning top or a doji around the area of the stall by price action. Also, if I was looking for the pair to move down, long wicks above the bodies a few of the candles would be good; or, if I was looking for the pair to move up, long wicks below the bodies would be a desirable sign.
To clarify what those candles and patterns look like on a chart, please refer to the chart below…
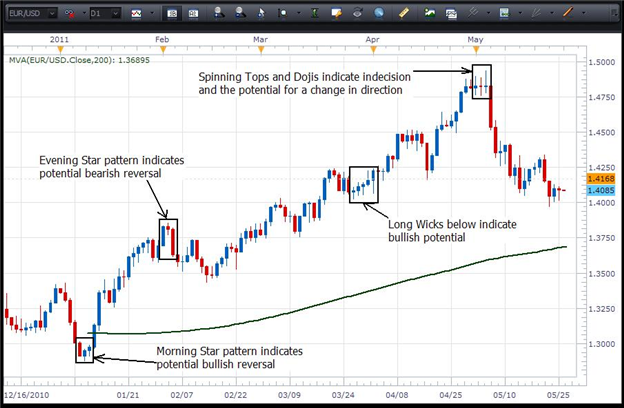
Remember: the “potential” for change presented by each of the above does not mean that a change of direction will, in fact, take place.


