


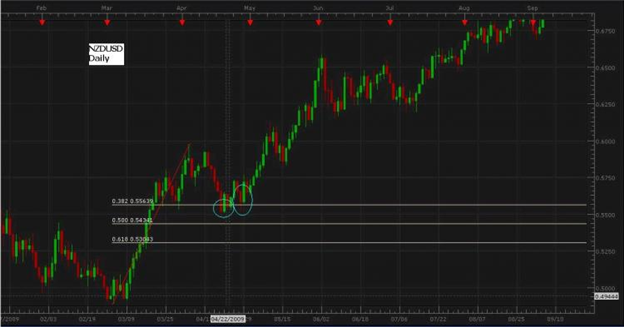
Student's Comment:This example is from a past daily chart of NZD/USD…hope that’s OK.Daily chart shows uptrend. I drew the Fib line from the bottom of the move to the top of the move.
First it breached the 38.2 level completely. So I would have waited for it to reach the 50.0 mark. But, then it showed a bullish engulfing. That pattern would have caused me to buy some lots.Is there anything wrong in trusting this candlestick pattern immediately after such a breach before it?
Instructor's Response:
Using an historical chart is fine. Regardless of the date of the chart, the trading principles remain the same.
In this case that interpretation would have worked quite well and I think it is a valid interpretation after the bullish engulfing occurs. Especially given that the pair is in an uptrend on this Daily chart.
That being said, there are no guarantees. Ideally, the highest probability Fib retracement trades are the ones that retrace to the 50% or 61.8% level.The key this type of trade will be stop placement. Placing it below the 50% level or below the lowest penetration by price of the 38.2% level would be a prudent level for a stop.


