


MACD histogram talking points:
- The MACD as a lagging indicator
- MACD histogram: What does the histogram represent?
- Using MACD histograms to identify bullish/bearish biases
The MACD as a Lagging Indicator
The MACD is an indicator that uses exponential moving averages (EMA) to determine trend strength along with entry points based on crossovers.
Traders who use the MACD indicator often are critical of the fact that it may signal an entry after the initial move has begun and therefore leave pips behind. As such, many traders wanting to enter a trade sooner dismiss it as a “lagging” indicator.
A lagging indicator is a technical indicator that uses past price data to formulate the actions of the indicator itself. Therefore, all indicators are lagging since they are computed on trading data that has already taken place and then factored in with what is occurring.
In the case of the MACD indicator, the most widely suggested entry signal is when the MACD line crosses over the signal Line in the direction of the trend. Since these two lines are simply two moving averages, by their very nature the crossover will not occur until the move itself is under way. Some traders prefer this method of suggested entry as it offers more confirmation that the move is more likely to continue in that direction however, the MACD histogram can offer an earlier signal to enter.

MACD Histogram: What does the Histogram Represent?
The histogram or “bar chart” included in the background of the MACD (see images below) displays the difference between the MACD and signal line. When the MACD is above the signal line, the bar is positive. When the MACD is below the signal line, the bar is negative. The actual height of the bar is the difference between the MACD and signal line itself.
MACD histogram:

For more aggressive traders who are not interested in the additional confirmation and are simply looking for a possible early entry, they may prefer this less widely used suggestive entry signal based on the MACD histogram bars. This is because the histogram bars have a faster setting (9) than either the MACD line or the signal line, resulting in a timelier trigger – see MACD crossover vs MACD histogram below.
MACD crossover vs MACD histogram:
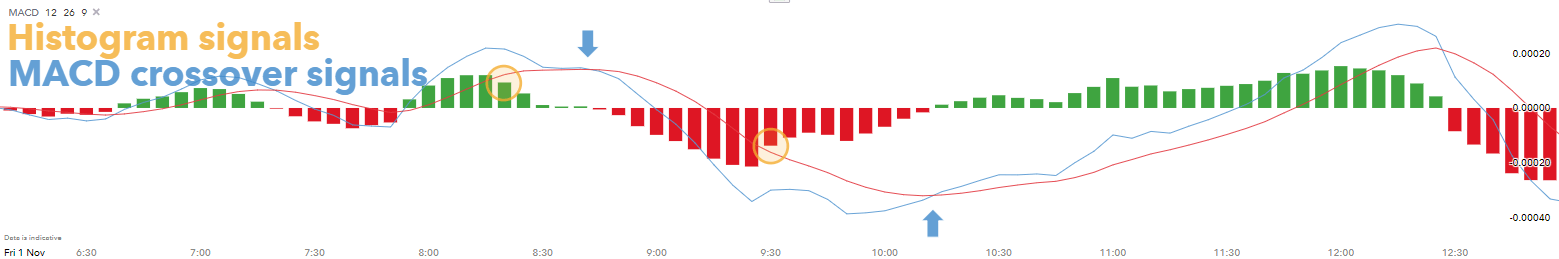

Using MACD histograms to identify bullish/bearish biases
The first point of analysis would be to pursue the MACD histogram as it moves away from the zero line (both positive or negative) - track it as its bars grow larger. The actual signal comes when the histogram no longer increases in height and produces a smaller bar. Once the histogram prints a smaller bar, traders look to enter in the direction of the histogram’s decline.
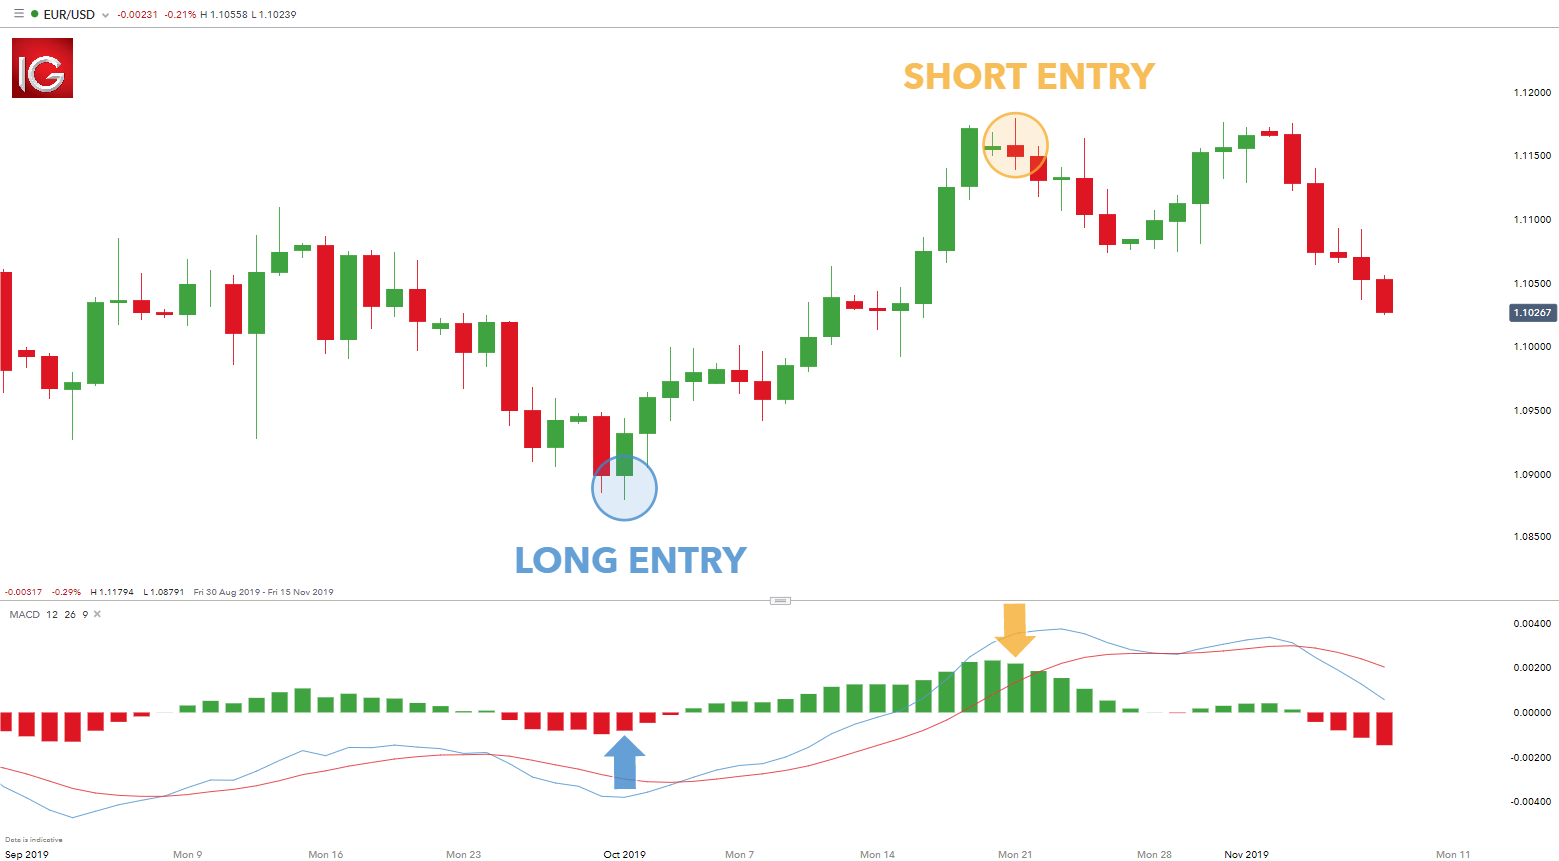
The suggestive buy signal on the left (blue) was created by five swelling red bars in a row followed by a fifth bar that closed smaller. Two bars later, the MACD line crosses above the signal line which is a traditional MACD signal. This later signal would have missed most of the move to the upside that the histogram signal would have caught.
The suggestive sell signal on the right (yellow) is a similar story. We saw fourteen bars growing consecutively until a contracted 15th bar was formed. This buy trade came several bars before the MACD/signal line cross.
EUR/USD MACD histogram buy sell signal:

Learn More About Technical Indicators
- Grow your foundational knowledge about technical indicators for forex traders
- Enhance your understanding of price action as an initial technical indicator
- Technical traders have different styles and forex trading strategies. Explore these thoroughly to find out if this type of analysis suits your personality
- If you are just starting out on your trading journey it is essential to understand the basics of forex trading in our new to forex guide