


The cup and handle pattern occurs regularly within the financial markets. Incorporating the cup and handle strategy within a trading system can enhance a trader’s market analysis technique.
What is a cup and handle pattern and how does it work?
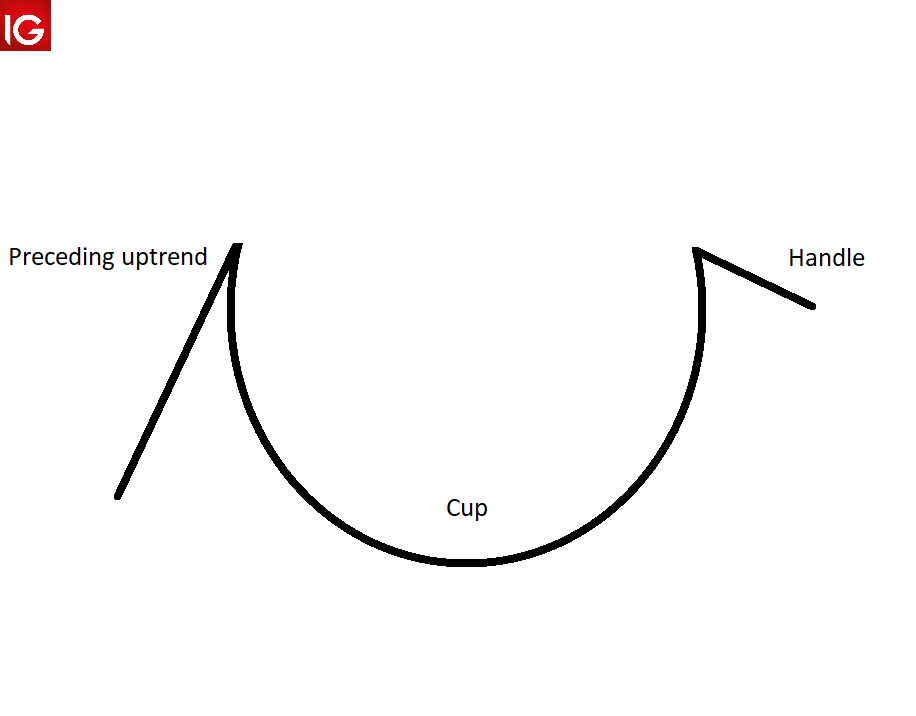
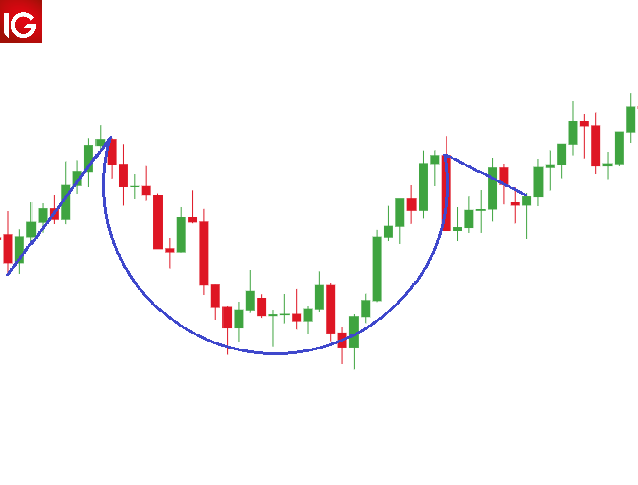
The cup and handle pattern is a continuation pattern that occurs after a preceding bullish or bearish trend. This formation provides traders with some distinctive features. The ‘cup and handle’ term translates to the bar chart pattern. The cup presents as a bowl shape whilst the handle is depicted as a downward slanting period of consolidation.

How to identify a Cup and Handle Pattern
The cup and handle pattern is slightly more complex as opposed to other chart patterns which can be tricky for some traders to identify. The steps below outline a simple guide to identify the cup and handle chart pattern successfully:
- The cup and handle pattern is considered to be a bullish continuation pattern therefore, identifying a prior uptrend is essential. This can be done using price action techniques or technical indicators such as the moving average.
- The cup should form more of a ‘U’ shape as opposed to a ‘V’ with the high points on either side of the cup being approximately even.
- The handle resembles a consolidation generally in the form of a flag or pennant pattern. This should be downward sloping but does consolidate sideways in some instances similar to a rectangle pattern.
- The breakout signal can occur in different ways depending on the trader’s preference. Some trader’s look at the resistance level taken from the horizontal between the highs of the cup. Once this breaks that level, entry will be confirmed. Other traders use a break of the handle trendline as a long entry point.
How to trade with the Cup and Handle Pattern
Trading with the cup and handle pattern differs slightly when using it to trade forex and equities. The volume function is often used in stock trading as a spike in volume indicates the breakout which confirms the entry signal.
Forex trading does not normally use this function, and instead involves other more conventional breakout confirmation methods such as breaks above resistance. The rest of the process is the same when trading the cup and handle pattern.
1) Trading stocks with the cup and handle pattern
Wynn Resorts Ltd example:
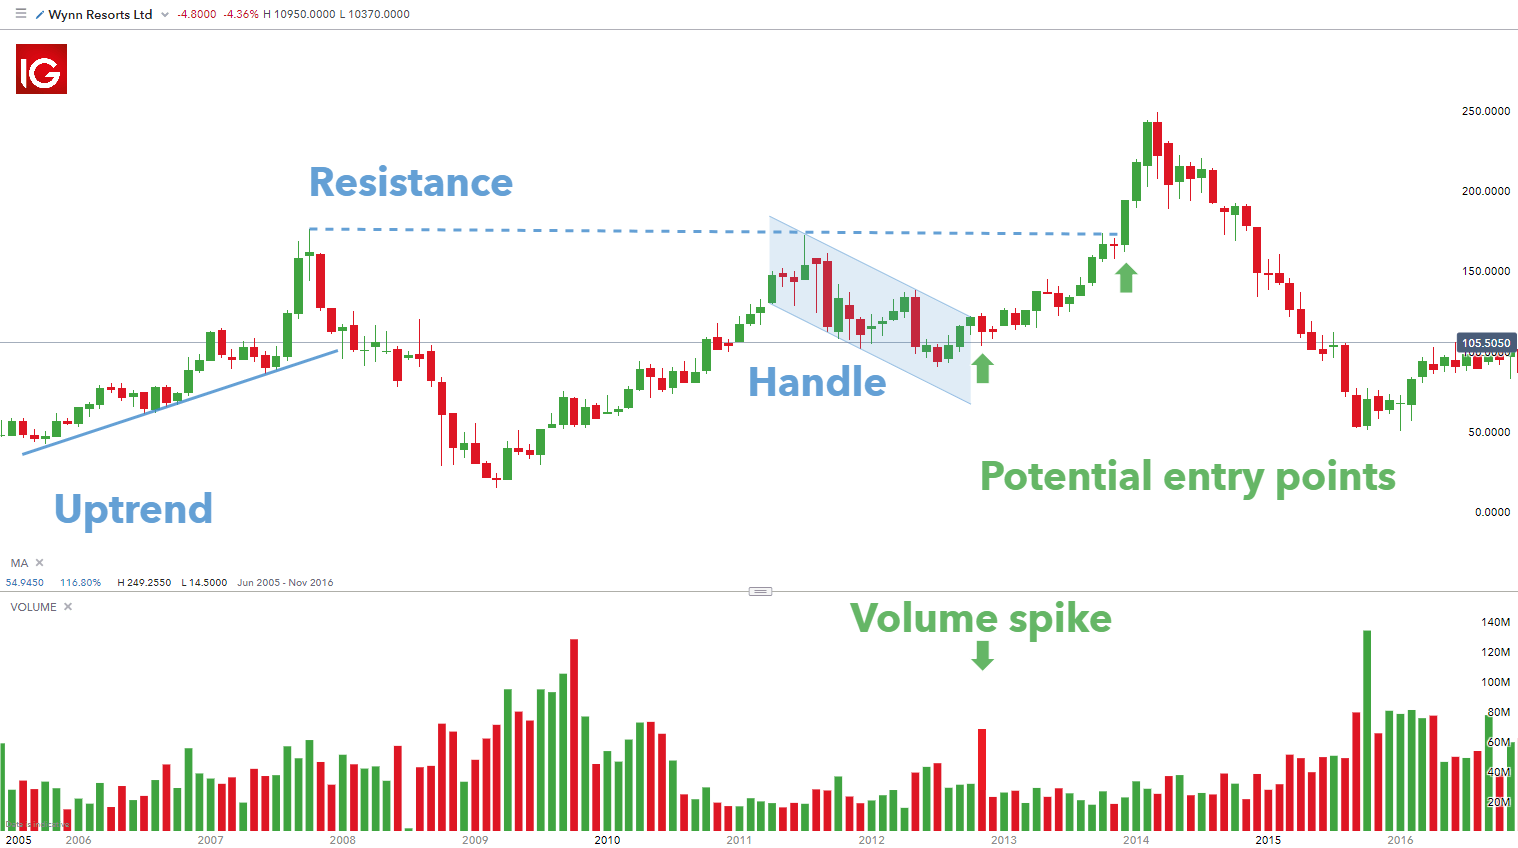
The image above is a monthly chart of the popular hotel and casino company Wynn Resorts Ltd. The chart exhibits a cup and handle formation with a clear prior uptrend as marked by the trendline showing higher highs and higher lows. A moving average may also be used instead to confirm the uptrend.
The chart shows two potential entry points denoted by the green arrows. The first entry takes place on the breakout above the upper end of the price channel akin to a bullish flag with a spike in volume as verification of the move up. The second entry uses the resistance level between the highs on either side of the cup as a key price level. Once this is broken, traders can look to go long. This method is less aggressive, but the patience of additional confirmation can shield against a false breakout with regards to the handle channel.
Stop levels are often taken from the low of the handle. This can then be projected by a factor of two to arrive at a take profit (limit) with a ratio of 1:2 risk-reward ratio. Other traders prefer Fibonacci extensions as a gauge for limit levels. This choice comes down to trader preference.

2) Trading forex with the cup and handle pattern
EUR/USD example:
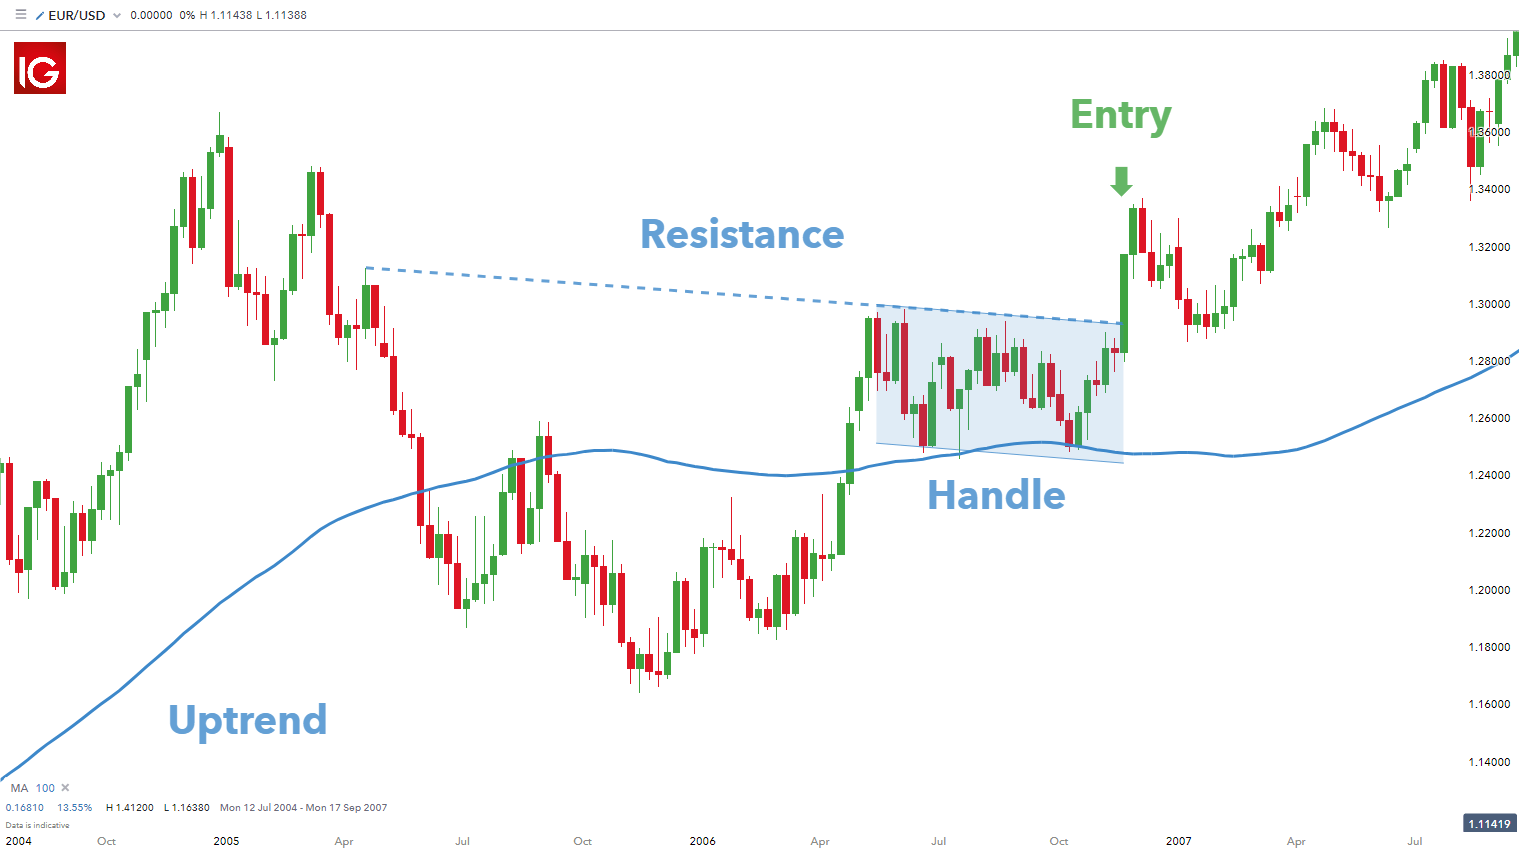
The cup and handle formation on the weekly EUR/USD chart above displays a potential buy opportunity. In this example the moving average is used to determine the former upward trend (price above the 100-day moving average).
This chart is unique in that the resistance line between the highs on either side of the cup and the handle price channel coincide. This gives the trader one entry point as a break above these two resistance points will be the same. The stop and limit points will be determined in the same manner as mentioned in the stock example. The only difference on this forex chart is the absence of the volume tool.
Advantages and Limitations of the cup and handle pattern
| Advantages | Limitations |
|---|---|
| Easy to identify for more experienced traders | Can be difficult to identify for novice traders |
| The cup and handle can be used for both stock and forex markets | Often requires further support from other technical indicators |
| Defines clear stop, entry and limit levels | The cup and handle can take extensive periods of time to play out |
Further reading on candlestick patterns
- Further your knowledge on other candlestick patterns with our guides to:
1. Rising wedge and falling wedge patterns
3. Double top
- Test your knowledge of forex patterns with our interactive 'Forex Trading Patterns' quiz.
- New to forex? Download our Forex for Beginners guide to learn the basics.