


Trading with the Harami Candle: Main Talking Points
The Harami candlestick pattern is frequently used in forex trading to identify trend reversals or extensions. Technical traders respect the indications produced by the Harami candle which makes this pattern invaluable in a trader’s arsenal. This article will cover the following principal topics outlining the Harami candlestick pattern in forex:
- What is a Harami candlestick?
- Uses of the Harami candle in forex trading
- Harami pattern trading strategies
- Read more on trading with Harami candlesticks

What is a Harami Candlestick?
The Harami candlestick is a Japanese candlestick pattern that comprises of two candles which indicates a potential reversal or continuation in the market. The word ‘Harami’ is derived from the Japanese word for ‘pregnant’ which is representative of the Harami candlestick pattern. The Harami candlestick pattern can signal both bullish and bearish indications as seen below:
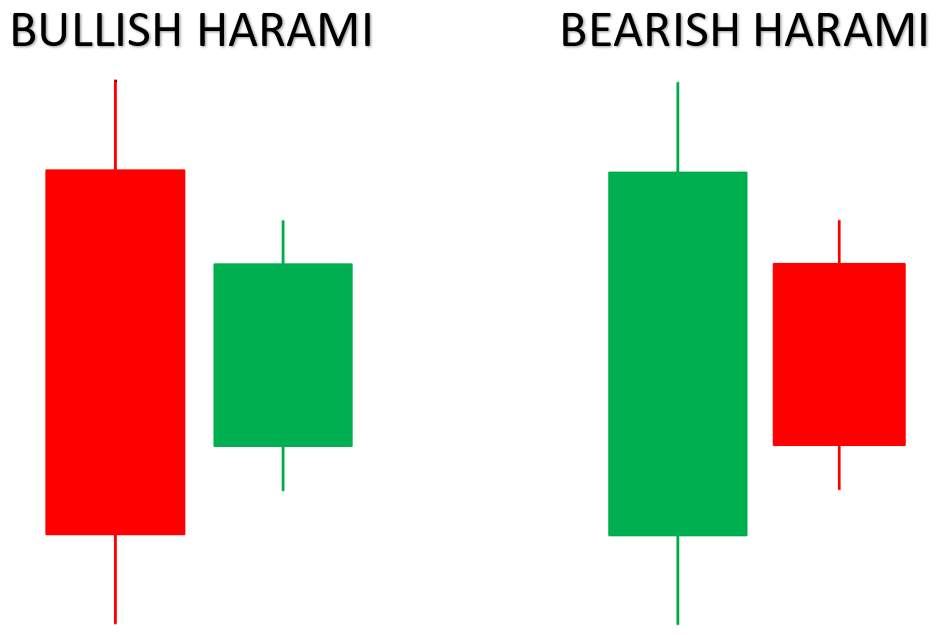
Bullish Harami:
- Established downtrend
- Leading larger bearish (red) candle
- Trailing smaller bullish (green) candle - price gaps up after bearish candle and is contained within the open and close of the leading bearish candle
Bearish Harami:
- Established uptrend
- Leading larger bullish (green) candle
- Trailing smaller bearish (red) candle - price gaps down after bullish candle and is contained within the open and close of the leading bullish candle
As indicated in the images above, the first candle (pregnant candle) is a large candle continuing the immediate trend and the trailing candle is a small candle protruding like a pregnant woman. It is important to note that technically the second candle will gap inside the first candle. However, gapping on forex charts is rare due to the 24-hour nature of forex trading. Therefore, the technically correct version of the Harami is rare in the forex market as gaps are minimal and the second candle often becomes a small inside bar of the first.
The confirming candle is used as a tool to tell traders if the smaller trailing gives life to a reversal or follows the trend with the starting candle. The popularity of the Harami pattern and other candlestick patterns is due to the ability to catch a reversal at the most opportune time with tight risk. This will allow traders to have very favorable risk-reward ratios.
Uses of the Harami Candle in Forex Trading
Advantages of the Harami pattern:
- Easy to identify
- Opportunity to capitalise on large movements with high risk-reward ratios
- Widely used in forex trading
Limitations of the Harami pattern:
- Requires confirmation before execution
Trading with the Harami Candle Pattern
The Harami candlestick pattern forms both bullish and bearish signals depending on the validating candle. The forex charts below exhibit both types of Harami patterns and how they feature within the forex market.
In both instances the candle labelled ‘3’ designates the confirmation candle which approves the pattern. With most candlestick patterns, traders can utilise other technical indicators to support the pattern.
Bullish Harami:
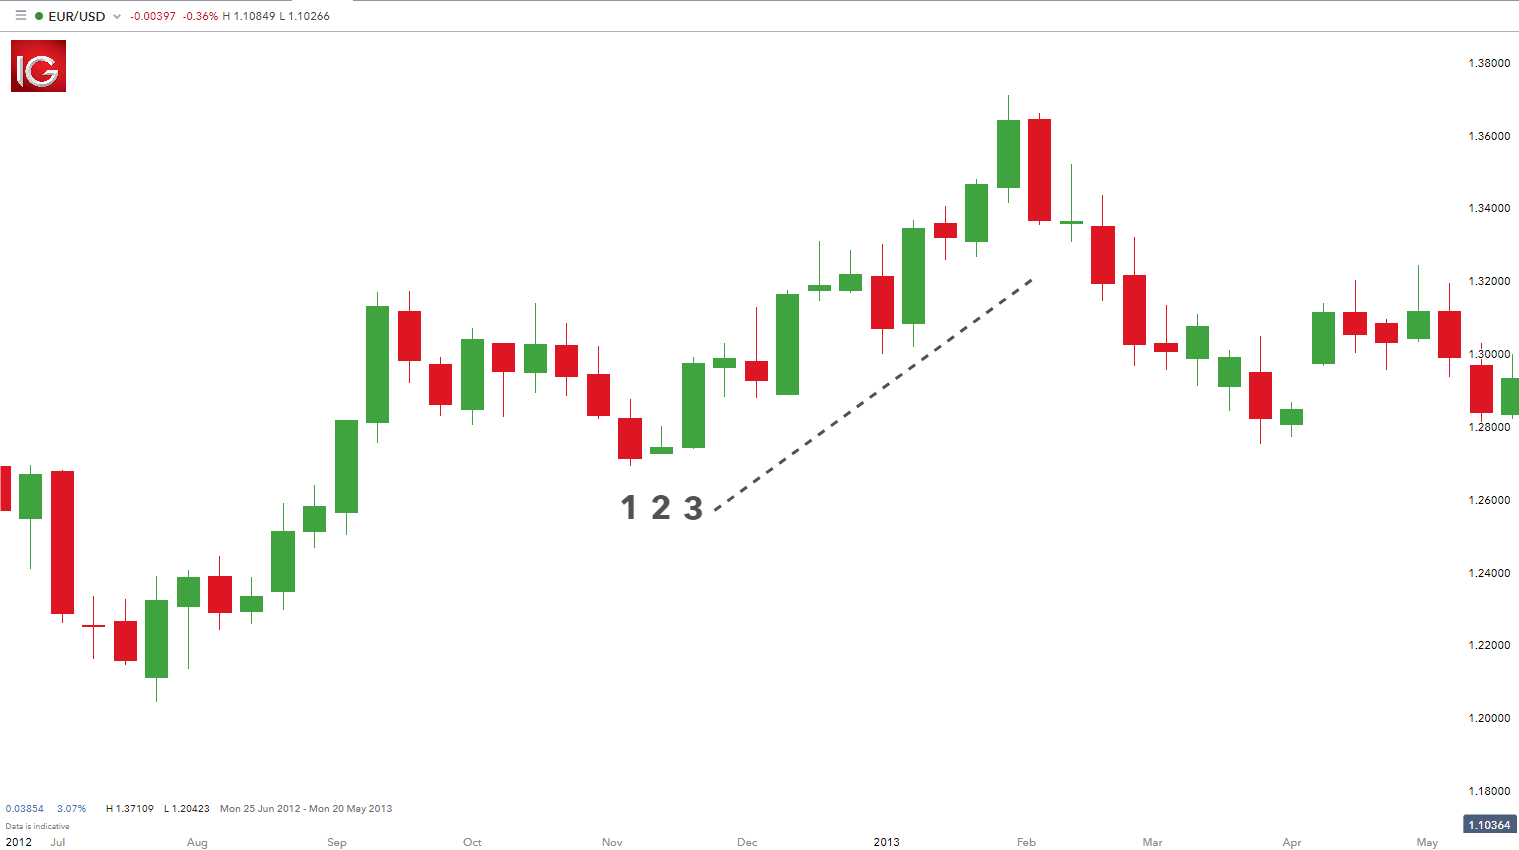
The Bullish Harami above represents a continuation of the current upward trend for the EUR/USD pair. This is important to remember because not all Harami patterns indicate reversals.
Bearish Harami:
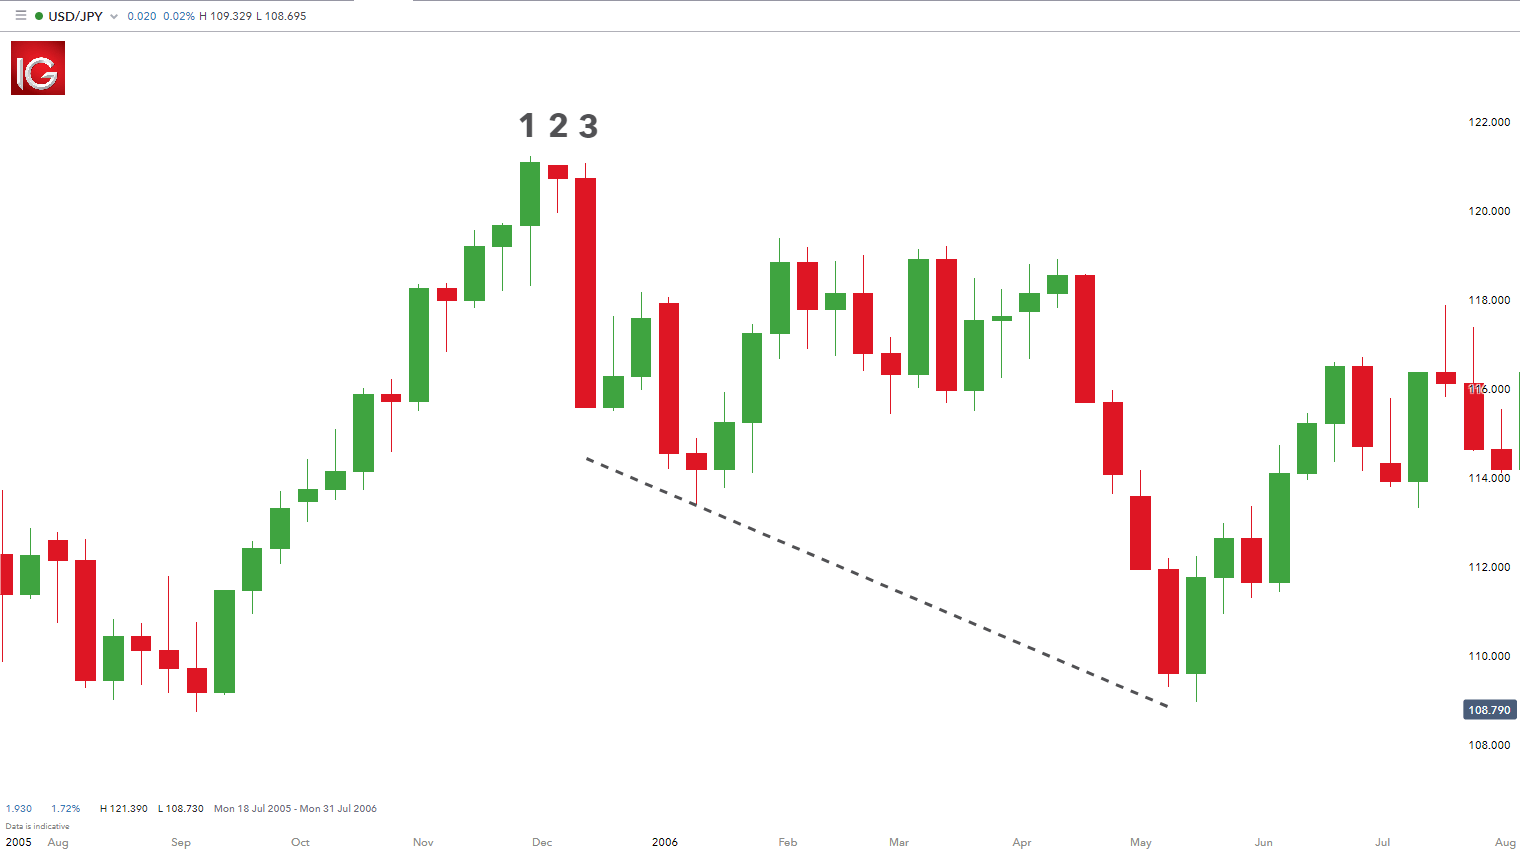
The Bearish Harami above displays how a reversal pattern is formed using the Harami candlestick pattern with the reversal occurring at the medium term high. Reversal signals are often stronger at significant price levels (support, resistance, highs and lows).
When traders interpret the Harami candles, context is vitally important. Analysing the previous charting pattern (trends) as well as price action will give the trader greater insight and ability to forecast the implications of the Harami pattern. Without context, the Harami is just three candles which are practically insignificant.
Read more on Trading with Harami Candlesticks
- Explore the Harami candle in relation to reversal patterns to identify possible trading opportunities.
- Reading a candlestick chart is an important foundation to have before analysing more complex techniques such as Harami and Doji candlesticks.
- When reading candlestick charts, be mindful of the time frames of trading, classic price patterns and price action.