


Trading with Shooting Star Candlesticks: Main Talking Points
Japanese candlesticks are a popular charting technique used by many traders, and the shooting star candle is no exception. This article will cover the shooting star reversal pattern in depth and how to use it to trade forex.
- What is a shooting star candlestick pattern?
- Advantages of using the shooting star in technical analysis
- Trading the shooting star pattern
- Further reading on how to trade with Candlesticks
What is a shooting star candlestick pattern?
A shooting star formation is a bearish reversal pattern that consists of just one candle. It is formed when the price is pushed higher and immediately rejected lower so that it leaves behind a long wick to the upside. The long wick should take up at least half of the total length of the shooting star candle – see image below.
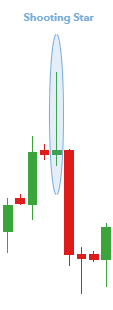
Additionally, the closing price should be near the low of the candle. As you can see, this creates an overall bearish structure because prices were unable to sustain their higher trade.
A similar structure is observed with the Inverted Hammer pattern however, the Inverted Hammer relates to a bullish reversal signal as opposed to a bearish reversal signal. This candlestick pattern is often revealed at the bottom of a downtrend, support level or pullback.
It is often questioned about the difference between a shooting star formation on a forex pair, stock or commodity. There is no variance between the different financial market types. A shooting star candlestick pattern will offer the same signal/s regardless of the instrument.
Advantages of using the shooting star in technical analysis
The shooting star pattern is a great tool for novice technical traders due to its simplicity. Spotting a potential shooting star candle is straight forward if traders adhere to the pattern description as explained above.
The candle pattern by itself will sometimes be flawed. However, if the pattern appears near a resistance level or trend line, then the shooting star can add confirmation to the new bearish bias. This is because a single candle is not extremely crucial in the overall trend or market movement.
Risk management is important to incorporate when using this candlestick pattern. This provides the trader with a ‘safety net’ should the market move negatively.
Benefits of the Shooting Star candlestick pattern:
- Easy to identify
- Reasonably reliable if all criteria are met
- Suitable for but not limited to novice traders
Limitations of the Shooting Star candlestick pattern:
- Shooting Star candle does not dependably define a short trade
- Confirmation is needed – further technical/fundamental justification
Trading the shooting star pattern
EUR/USD Shooting Star Candlestick Pattern:
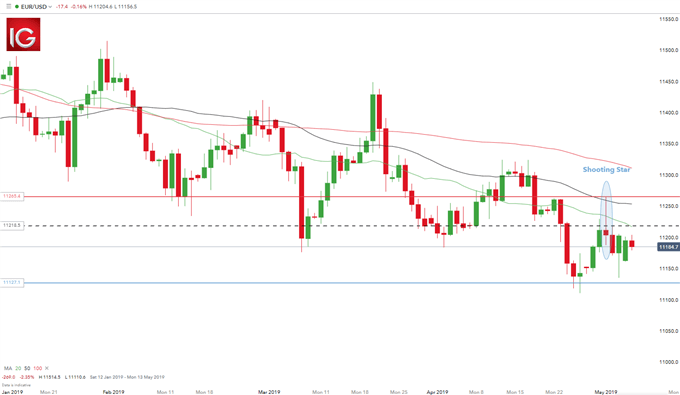
Trading this reversal pattern is fairly simple. First, the implication is for lower prices therefore we want to look for entries to short. Since the prices were previously rejected at the high of the shooting star, we will look to establish the stop loss at the recent swing high (red horizontal line on the chart).
A trader could simply enter on the open of the next candle or, if the trader was more conservative and wanted to capture a better risk-to-reward ratio, trade the retest of the wick (black dashed line). Retests of the wick tend to occur when the wick is longer than normal.
Often prices will come back and retrace upward a portion of the long wick. A trader recognizing this might wait to enter around the middle of the wick rather than enter immediately after the shooting star candle forms. This means the trader is entering a short trade at a higher price and with a tighter stop loss reducing risk. Regardless of the entry mechanism, the stop loss will remain the same.
Regarding profit targets (blue line), DailyFX communicates taking profit at least twice the distance of the stop loss. So, if the stop loss is 90 pips away from the opening level, then look for at least 180 pips of profit potential. This commonly refers to a 1:2 risk-to-reward ratio which falls in line with the Traits of Successful Traders research.

Further reading on how to trade with Candlesticks
- For more on candlestick patterns, refer to our article on the Top 10 Candlestick Patterns to trade the markets.
- Supplement your understanding of forex candlesticks with one of our free forex trading guides.
- Further your knowledge on candlesticks with a foundational piece on forex candlesticks.