


Enjoy the video? Join Paul Tuesday-Friday each week – for details, please see the Webinar Calendar.
This webinar was part-one of a two-part series on classic chart patterns, with today’s focus on three simple, but effective chart patterns. The ‘Head-and-Shoulders’ formation, both its bearish and bullish variations, rising (bearish) and falling wedges (bullish), and double tops and bottoms. To attend part II, which will be on November 16 at 10:30 GMT, you can sign up here.
Head-and-Shoulders
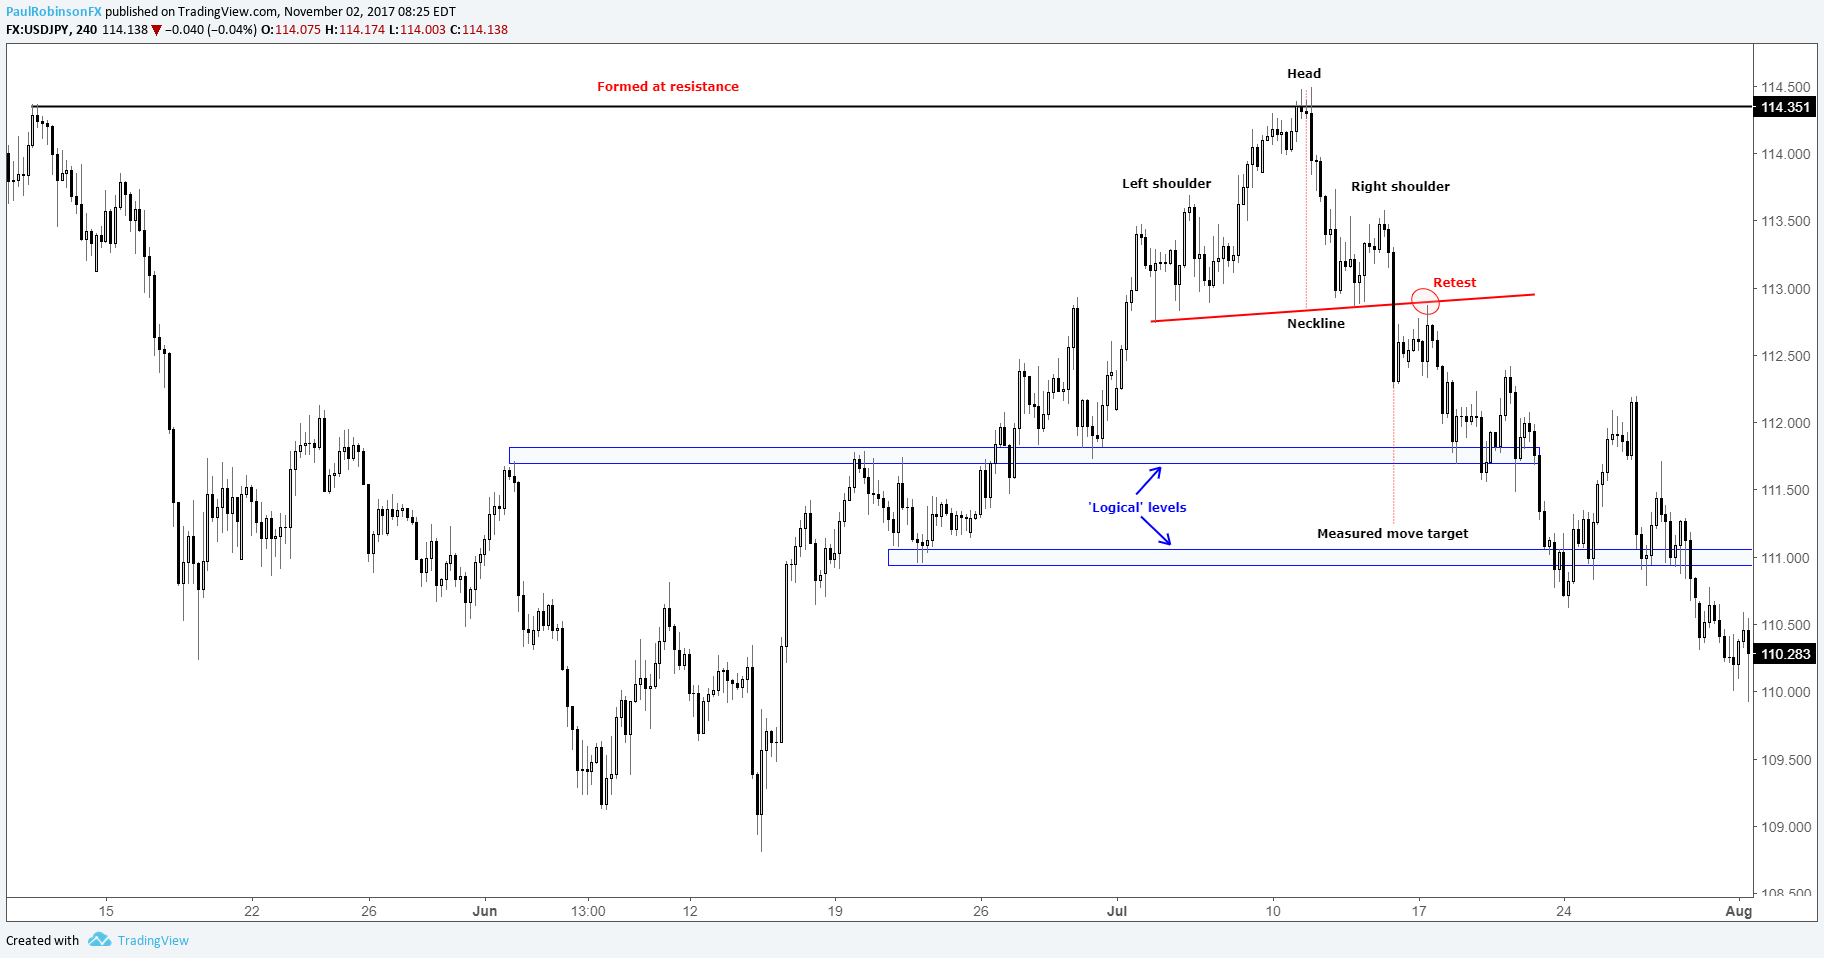
We started out with a personal favorite – the ‘Head-and-Shoulders’ pattern. It consists of four key components to make for a completed sequence – 'Left shoulder', 'Head', 'Right shoulder', and the 'Neckline'. It can be a powerful topping and bottoming pattern depending on whether it forms after a sizable advance or decline. There are often-times price sequences which start to take on the shape of an H&S pattern, but we can’t truly call it a confirmed pattern until we see a closing bar below the neckline (above for an inverse, or bullish configuration). The closing bar is dependent on the time-frame which the formation is observed on – i.e. daily, 4-hr, etc. But it is very important to remember to wait for that close or else you can find yourself in a situation of selling or buying a false breakout.
Execution comes down to key three points just as it does with any trade – entry, stop-loss, and target. The entry, as already explained, must come on a confirmed break of the 'neckline'. The stop-loss should be placed sufficiently above the neckline. Two common points of reference for stops is the confirmation bar which triggered the pattern and the trend-line running from the ‘head’ across the ‘right shoulder’. Stops should be placed beyond those point to allow for wiggle room. There are a couple of approaches when establishing a position-size on the break; take a full position on the break, and the other is to enter 50% on the break and another 50% on the first pullback, with the most ideal spot coming on a retest of the neckline.
The target is determined by the symmetry of the pattern and by identifying ‘logical’ support and resistance points on the chart. The symmetry target is called a ‘Measured Move Target’ (MMT), and is simply calculated by taking the height of the formation from the ‘head’ to the ‘neckline’ and subtracting it from the ‘neckline’. For a bullish pattern, simply the opposite. ‘Logical’ levels are typically determined by looking at where price support and resistance levels are in relationship to the MMT. Sometimes these levels will be ahead of the end-target, other times beyond.
Check out this guide for ideas on how to Build Confidence in Trading.
USDJPY: 4-hr
Rising & Falling Wedges
This classic reversal pattern is simply a steeply angled triangular pattern which can mark the end of an extended move. It’s important to keep in mind that the rally or sell-off prior to its formation should have been lengthy. These patterns occur as volatility contracts and one side of the market is falsely given a sense that the trend will continue. In the case of a rising wedge the market is still making higher-highs and higher-lows (Falling wedges are in reverse; lower-lows and lower-highs).
To trigger a rising wedge the bottom-side trend-line needs to be broken. Falling wedges - the top-side trend-line. Stops are best placed above the high of a bearish formation and below the low of a bullish configuration. The target is the lowest (for bearish) and highest (for bullish) point of the pattern itself, or ‘logical’ points of support and resistance along the way. This is generally a good area of support or resistance from a price standpoint. But price can certainly extend well beyond, which is why it is a prudent idea (and this goes for any pattern-trade) to watch how price action behaves around targeted levels. If momentum is strong, then being patient and allowing price to continue on can take a good risk/reward trade and turn it into one with a much better risk/reward profile.
One of the examples we looked at was a rising wedge in EURGBP not long ago which had an ‘overthrow’ (a fake-out beyond the top of the pattern) before dropping precipitously once it traded below the underside of the pattern. These false breakouts draw in the ‘wrong-way’ crowd one final time, and as a result can lead to even more powerful declines once price begins to decline and stops are hit.
EURGBP: Daily

Double Tops/Bottoms
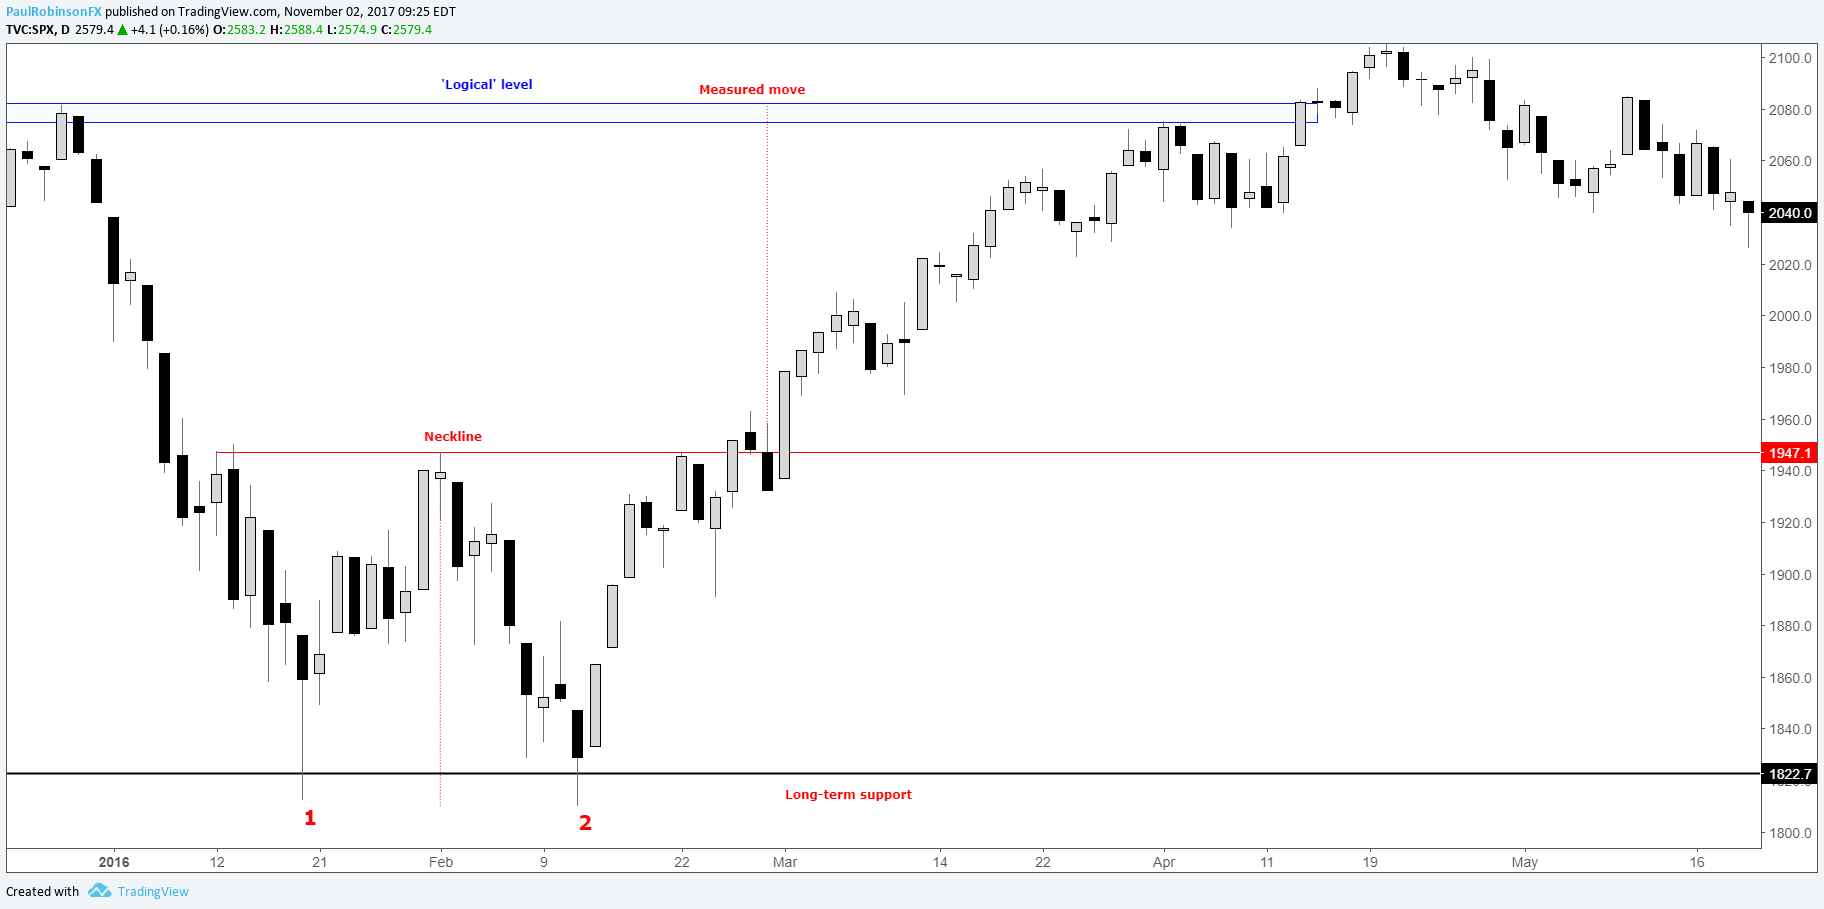
These are very simple. A double-top is the failure for price to move beyond a prior peak and then drop back below the most recent swing-low (or often times referred to as the ‘neckline’). The textbook way to enter the market is on a confirmed close below the ‘neckline’, with a stop placed above the ‘neckline’ of the pattern. Targets are determined by taking the height of the formation and subtracting it from the ‘neckline’. But just as mentioned already, using ‘logical’ price levels is sound practice. Double-bottoms are simply the bullish variation, as seen in the example below.
S&P 500: Daily
For the full conversation, please see the video above…
Prior ‘Becoming a Better Trader” webinars you may be interested in: Analysis, keeping it simple; Using a Checklist; Risk Management; Handling Drawdowns; 6 Mistakes Traders Make; Focusing on the Process; Creating a Trading Plan
---Written by Paul Robinson, Market Analyst
You can receive Paul’s analysis directly via email by signing up here.
You can follow Paul on Twitter at @PaulRobinonFX.


