


Talking Points:
- Moving Averages Help Traders Determine the Markets Prevailing Direction
- A Series of Moving Averages Can Help Determine Market Retracements
- Traders Looking for a More Sensitive Average May Consider Using an EMA
New to trading? You may enjoy our trading guides
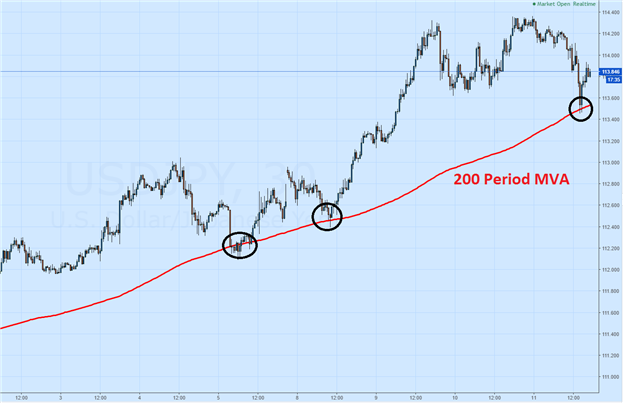
Finding the direction of current market momentum is an important step for trend traders. Moving averages are a unique tool that help traders to just that on a variety of charts and time frames. A 200 period MVA (simple moving average) is often employed for this task, with traders looking to see if prices are currently above or below the average. If prices are trading above the 200 period MVA, the trend and market momentum may be interpreted as rising. As well if prices are below the average, this may be interpreted as a declining market.
USD/JPY, 30 Minute Chart with 200 Period MVA
Often times, one line of reference may not be beneficial to a trader. To get a more complete look at momentum, traders may employ a series of MVA’s. Typical averages include the 20,50, and 200 period MVA’s. While the settings of the averages can be changed, traders should consider having a short, mid, and long term MVA for reference. In an uptrend, the shortest moving average should reside above the mid and long term lines. Alternatively in a downtrend, the short term average should be below both the mid and long term lines.
Interested in Joining Our Analysts, Instructors, or Strategists For a Free Webinar? Register Here
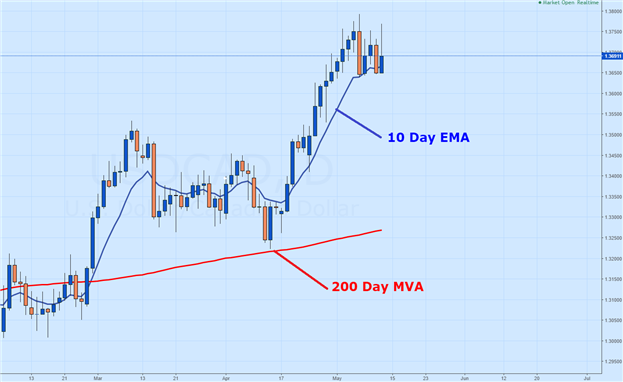
Lastly, once traders are familiar with traditional averages, traders may expand their knowledge base to include other interpretations of moving averages. EMA’s (Exponential moving average) are similar to traditional MVA’s, however these lines are weighted. This means EMA’s are more sensitive to change in present market price than traditional MVA’s. Their sensitivity makes them a great tool for finding short term shifts in momentum on longer term charts.
USD/CAD, Daily Chart with Averages
--- Written by Walker, Analyst for DailyFX.com
To Receive Walkers’ analysis directly via email, please SIGN UP HERE
See Walker’s most recent articles at his Bio Page.
Contact and Follow Walker on Twitter @WEnglandFX.


